TDM Data Management System 6.0
From ICISWiki
Contents |
INTRODUCTION
The Data Management System (DMS) is the component of ICIS that manages environmental data, germplasm characterization data and evaluation data for genetic resources and crop improvement projects. DMS links these data to genotype information in the ICIS Genealogy Management System (GMS) and to location information in the Location Management Module (LMM) as well as providing links to other specialized data sources. DMS also allows integration of data from different studies, thus permitting a broad range of queries across trials or types of factors and variates.
The Functions of the DMS are to:
- store and manage documented and structured data from genetic resource, variety evaluation and crop improvement studies,
- link data to specialised data sources such as GMS, soil and climate databases and
- facilitate enquiries, searches and data extraction across studies according to structured criteria for data selection.
Although there is an implicit emphasis on germplasm in the ICIS project, the DMS can be used for data from other research areas, e.g., natural resources and economics. Consequently, the logical structure being developed will consider any research data, whether explicitly concerned with genetic resources or not. Clearly, data which are not concerned with genotypes need not be linked to GMS, but other functions remain relevant.
All types of data will be accommodated in DMS including raw data observed data, derived data and summary statistics. Data may have continuous or discrete numeric values or text or categorical character values. For example, observations on disease resistance or nutrient efficiency of a genotype can be numerical measurements, scored or calculated indices or text data. More complex forms of data, such as pictures or documents will also be considered.
As a general principle, any data that are routinely represented in field books or laboratory books or spread sheets will be accommodated in DMS provided they are static. That is, data linked by dynamic formulae to other data in tables or spreadsheets will be considered as fixed at the values they had at the time the data is loaded into DMS. Another principle underlying the design of DMS is that it will handle data and documentation on the basis of individual studies. Integration across studies will be facilitated by another module known as the Data Property Management Module (DPMM) described in Chapter 8.
Research programs are routinely managed in a hierarchy of aggregation. For example at IRRI, this is represented by the sequence: Program, Project, Output and Activity. Below this are the individual experiments or surveys which we will term Studies. The first four levels are administrative and are managed by a Project Management System which is largely concerned with budgeting, planning, resource allocation and reporting. The DMS is concerned with the last category, Study, and at IRRI the DMS will link to the Project Monitoring System via a Project Monitoring Key.
THE DMS DATA MODEL
In order to clarify the definition of entities in the DMS data model we will consider data from a typical split-plot field experiment. Results of such a study could be represented as in the following table:
Table 4.1 Serial Spread-sheet Representation for a Split-plot experiment
| STUDY | REP | MAINPLOT | SUBPLOT | VARIETY | GID | FERT | YIELD |
|---|---|---|---|---|---|---|---|
| S9801 | 1 | 1 | 1 | B | 100 | 100 | 10.3 |
| S9801 | 1 | 1 | 2 | B | 100 | 200 | 12.7 |
| S9801 | 1 | 2 | 1 | C | 102 | 200 | 18.4 |
| S9801 | 1 | 2 | 2 | C | 102 | 100 | 13.7 |
| S9801 | 1 | 3 | 1 | A | 105 | 100 | 12.6 |
| S9801 | 1 | 3 | 2 | A | 105 | 200 | 16.7 |
| S9801 | 2 | 1 | 1 | B | 100 | 200 | 19.2 |
| S9801 | 2 | 1 | 2 | B | 100 | 100 | 12.3 |
| S9801 | 2 | 2 | 1 | A | 105 | 100 | 17.1 |
| S9801 | 2 | 2 | 2 | A | 105 | 200 | 14.1 |
| S9801 | 2 | 3 | 1 | C | 102 | 200 | 16.3 |
| S9801 | 2 | 3 | 2 | C | 102 | 100 | 12.2 |
Data sets are typically arranged in columns as in Table 4.1, we call the columns VARIABLES since each row may record a different value for each variable. The first seven variables define the source and context of the data. We refer to such variables as FACTORS. The eighth variable contains measured data. We call these data variables VARIATES, there are usually several variates in a data set. Table 4.1 represents all factors serially. Occasionally, for easier comparison or more compact presentation, variates are split into parallel columns, one for each level of a factor. For example we could have used a table with six rows, four columns containing factors, and two columns containing the variate, one for YIELD AT FERT 100 and one for YIELD AT FERT 200, deleting the SUBPLOT and FERT columns. In this representation the factor FERT is in parallel. Such parallel spreadsheets can always be converted to serial format and hence we consider spreadsheets with all variates represented serially to motivate ourdata model. The factor STUDY has only one level and so is usually omitted in field books, but it is always implied and we shall use it explicitly to link other study properties to the data.
The distinction between FACTORS and VARIATES is not always as clear as in Example 4.1 and certainly a variable describing a property such as nitrogen fertilizer may appear as a FACTOR in one experiment and as a VARIATE in a survey study. This ambiguity is accepted by the data model but the DPMM accommodates it and allows integration across studies by using a common controlled vocabulary for FACTORS and VARIATES. Location and time of observations are treated in the same way as other contextual information. Georeferences, rows and columns or other coordinates may appear as FACTORS or VARIATES and in the case of georeferences are linked to the LMM and are hence accessible to GIS applications. Discrete sampling times or locations may be expressed as FACTORS, but continuous ones need to be treated as VARIATES which are linked by context to the observation variates they describe.
STUDY
A STUDY is the basic, reportable unit of research, it is synonymous with the notions of experiment, nursery or survey. Since DMS must deal with any of these we will use the term study. A study is characterized by a set of scientific objectives and testable hypotheses and results in the collection of one or more data sets similar to that in table 4.1. The division of data into sets is usually motivated by convenience, for example data collected from different sampling scales is most conveniently treated in different data sets. Similarly, data collected at different times or from different locations are also often treated as different data sets, although it is feasible to treat these divisions in a single data set. The point is that DMS is flexible enough to manage data in all the ways that researchers require.
FACTORS, LABELS and LEVELS
FACTORS are classifying variables in a study which take values from finite sets of discrete LEVELS. These levels are usually labeled in some way to document the source and context of the data by expressing the conditions under which the data were collected or derived. For example, the names of treatments or design structures applying to the unit or units from which the data are recorded, or conditions such as the time and location of measurement. These LABELS are usually listed in columns in the data set as in Table 4.1 The study itself will be treated in the data model as a factor with exactly one level, the study name. Hence, every study has at least one factor.
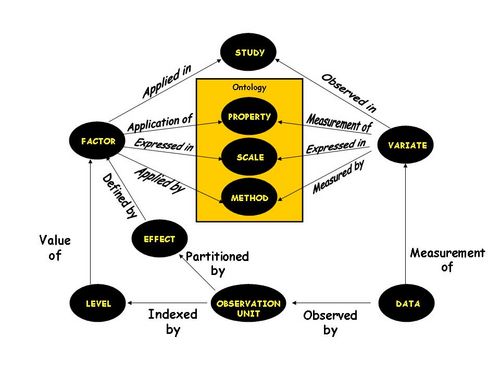
A single factor is often represented by more than one set of LABELs. For example the genetic entities in a trial may be represented by entry number and entry name. Each of these is a different LABEL for the factor. Generally labels carry different information about the levels. VARIETY and GID in Table 4.1 are labels of the same factor, one containing names, A, B, C and the other containing GIDs which link to GMS. In DMS, LABELS belonging to the same factor are linked together by a single Factor ID. Note that while the first, and possibly only, LABEL for a factor must uniquely identify all LEVELS of that factor, subsequent LABELs need not identify all levels or may even label several levels in the same way. However no level can have more than one value of the same LABEL. Hence, in Table 4.1, FERT is not a label of MAINPLOT, and VARIETY is not a label of SUBPLOT, these are independent factors which lead to alternative representations of the field objects. Factors are named and described in each study, they have three main attributes, the PROPERTY of the experimental material or survey units being manipulated or stratified, the METHOD or procedure by which the levels are applied and the SCALE or measurement units in which the levels are expressed. All levels of a particular factor are expressed in the same scale. Names of factors are consistent within studies and equivalent factors are linked across studies through common PROPERTYs. PROPERTY is subject to a controlled vocabulary to facilitate this linkage. This vocabulary is managed through the Data Property Management Module (Chapter 8).
STUDY FACTORS are factors with a single level which applies to all observation units in a study. The study itself is such a factor with study name as the sole level. Other study factors are represented as labels of the study name and can be used to document global conditions. The same PROPERTY may be represented by a STUDY FACTOR in one study and a multi-level factor in another. As far as possible, general properties of all units in a study should be expressed as STUDY FACTORS because the factor structure and management will allow full integration across studies. For example, non-treatment conditions, which could include variety, irrigation, planting method and weed control should, where possible, be expressed as STUDY FACTORS.
OBSERVATION UNITS
Data sources such as field objects or sampling units are identified by combinations of levels of design or sampling factors. In Table 4.1 the factors REP, MAINPLOT and SUBPLOT are all design factors and combinations of one level from each identify physical sub-plots in the study. Other factors define the context of the data, in experiments these are called treatment factors. Combinations of one level from each treatment factor define the treatments which are applied to field objects. In Table 4.1 VARIETY and FERT are treatment factors. Data values such as treatment means are associated with level combinations of treatment factors which do not correspond to field objects but which can be thought of as data sources. Both types of data sources, field objects and treatment combinations, are referred to as OBSERVATION UNITS. Observation units are conceptually equivalent to rows in a serially structured spreadsheet. OBSERVATION UNITS are the real and conceptual data sources in a study defined by distinct level combinations of one or more factors. Not all factors in a study are involved in this indexing for every OBSERVATION UNIT. However the STUDY FACTOR, with its single level, is involved in indexing every OBSERVATION UNIT. Hence OBSERVATION UNITS belong to unique studies. Every study has a STUDY UNIT which is the single observation unit indexed by the level of the STUDY FACTOR alone.
VARIATES
Each study involves the recording of data for one or more properties of some observation units. The data being recorded are described by VARIATES and are often represented as columns in spreadsheets, such as the YIELD column in table 4.1. Each VARIATE has the same three attributes as a FACTOR: the PROPERTY or trait being measured, the METHOD or procedure by which the value is observed or derived and the SCALE or measurement units in which the value is expressed. VARIATES are named and described within studies and the name should be consistent throughout a study. The common vocabulary of PROPERTYs links VARIATES across studies in the same way that FACTORS are linked across studies. All values of a particular variate should be of the same data type. At present three types are being considered numeric, character (<50bytes) and text (memo). This range can be extended to cover other types such as binary, picture, link or other object. There is also the possibility to define variate types such as observed scaler, derived scaler, observed vector element, derived vector element. This gives the possibility to define multivariate observations: Ids of variates with vector type could point to a vector table indicating the other elements of the multivariate structure.
DATUM and VALUE
The central entity in the DMS data model is the DATUM which links to exactly one OBSERVATION UNIT and exactly one VARIATE. The DATUM is conceptually equivalent to a cell in a variate column of a spreadsheet or field book. The most important attribute of a datum is its VALUE which is the recorded value of the associated VARIATE for the associated OBSERVATION UNIT. Each DATUM belongs to a unique study according to its VARIATE and OBSERVATION UNIT. Data values which pertain to the whole study, such as measured site characteristics in a single site study, are linked to the STUDY UNIT. Data in DMS will not be actively linked to other data values by formulae as is possible in some spreadsheets. Data values can have any data type such as integer, real, character, text, date, time or even image or document. Data from multiple studies may be exported for reporting or combined analysis, but if they are to be managed as a set in DMS they must be copied to a single study which may have integrative interpretation as its sole objective. It may be necessary to ensure that each VARIATE-OBSERVATION UNIT pair can have only one DATUM. This is required to uniquely identify a data value, for example to link it with a data attribute (4.2.8). The consequences of this are that repeat observations on any unit or multiple observations taken at irregular time intervals need to be indexed by a new factor which may have numerous of varying numbers of levels for each field object.
Multiple representations of OBSERVATION UNITS
Clearly, in Table 4.1 we have more factors than necessary to identify the 12 sub-plots. In fact the level combinations of REP, MAINPLOT and SUBPLOT or any triple with MAINPLOT and/or SUBPLOT replaced by VARIETY and FERT respectively, will uniquely define the sub-plots. One reason why this redundancy occurs is because different factorial representations of observation units are convenient at different times during the execution of a study. At the design stage, REP, MAINPLOT and SUBPLOT will be used. At the lay-out stage, a new factor, PLOT, may be defined, as in Table 4.2, with levels PLT01 to PLT12 which label the sub-plots. At the time of treatment application, REP, VARIETY and FERT may be recorded.
Table 4.2 illustrates how a new variate like pre-planting weed density, WEEDS, and a new FACTOR like PLOT may be added to existing data in a study. In some cases the new data may come from new OBSERVATION UNITS, but in this case PLOT is a new representation of existing units, the sub-plots. It is important to note that whenever a new representation is used for the first time it must appear with one of the previous representations of the same units. For example to load the new data in Table 4.2 we would have to add REP, MAINPLOT and SUBPLOT or REP, VARIETY and FERT columns to explicitly define the representation otherwise the rows of the new table will be treated as new OBSERVATION UNITS.
Table 4.2 Data obtained from the Lay-out stage of a Split-plot experiment
| STUDY | PLOT | WEEDS |
|---|---|---|
| STUDY | PLOT | WEEDS |
| S9801 | PLT01 | HIGH |
| S9801 | PLT02 | HIGH |
| S9801 | PLT03 | MED |
| S9801 | PLT04 | LOW |
| S9801 | PLT05 | HIGH |
| S9801 | PLT06 | LOW |
| S9801 | PLT07 | LOW |
| S9801 | PLT08 | MED |
| S9801 | PLT09 | HIGH |
| S9801 | PLT10 | LOW |
| S9801 | PLT11 | MED |
| S9801 | PLT12 | LOW |
EFFECTS
Effects are sets of observation units in a study which are indexed by levels of subsets of the FACTORS in the study. For example in Table 4.1, with the STUDY factor fixed, REP and MAINPLOT index the set of six main plots in the study. Similarly, VARIETY and FERT index a set of units relating to each treatment.
Effects form natural hierarchies according to the nesting of their index-factor subsets. For example the sub-plot effect of Table 4.1, indexed by factors REP, MAINPLOT and SUBPLOT, is nested within the main-plot effect indexed by REP and MAINPLOT only. Several effect hierarchies may be important in a single study. For example the design hierarchy for Table 4.1 includes sub-plots, whole plots, reps, and site but there is also a treatment hierarchy. This also starts with sub-plots, but now indexed by REP, VARIETY and FERT which are nested in a treatment effect indexed by VARIETY and FERT and which in turn nests VARIETY and FERT effects. The treatment hierarchy amalgamates different sets of field objects from the design hierarchy because of the randomization of treatments to field objects. Other studies have yet other hierarchies of interest such as genetic studies where there may be a genealogical hierarchy.
Data associated with different effects may result from data collection at different sampling scales or on different field objects, but they often arise by statistical amalgamation of data values over related units in lower level effects. The interest in data amalgamated over different hierarchies is another reason why multiple representations of OBSERVATION UNITS occur.
Table 4.3 Treatment means for the Split-plot experiment of Table 4.1
| STUDY | TRT | VARIETY | FERT | YIELD |
|---|---|---|---|---|
| S9801 | 1 | A | 100 | 14.85 |
| S9801 | 2 | A | 200 | 15.40 |
| S9801 | 3 | B | 100 | 11.30 |
| S9801 | 4 | B | 200 | 15.95 |
| S9801 | 5 | C | 100 | 12.95 |
| S9801 | 6 | C | 200 | 17.35 |
Table 4.3 shows treatment means from Table 4.1. It introduces new OBSERVATION UNITS for the treatment effect, and these have two representations, one indexed by existing factors VARIETY and FERT and another defined by the new factor TRT. It is possible to define sub-effects by fixing levels of some indexing factors. This would allow more precise grouping of OBSERVATION UNITS. Also, special EFFECT UNITS could be defined to represent all units in a particular effect. In this way data relating to all the units, such as Standard Errors or other statistical parameters can be linked to EFFECT UNITS instead of having to be repeated for every OBSERVATION UNIT in the effect. EFFECT UNITS could be managed like other OBSERVATION UNITS but with missing values for the levels of indexing factors.
ATTRIBUTES
It is possible for users to define new data fields for any entity in the data model – USER DEFINED FIELDS. These can be stored as DMS ATTRIBUTES for elements having unique Ids within entities. For example studies, variates or factors. Data values require two Ids, VARIATE and OBSERVATION UNIT so attributes for data values are managed as DATA ATTRIBUTES.
Fig 4.2.1 SCHEMATIC EXAMPLE OF THE DMS DATA MODEL The following tables give a schematic representation of the example data from tables 4.2.1, 4.2.2, and 4.2.3 in the format of the DMS data model
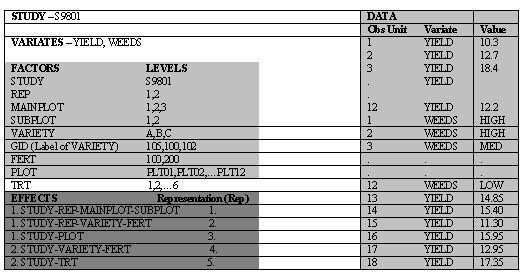
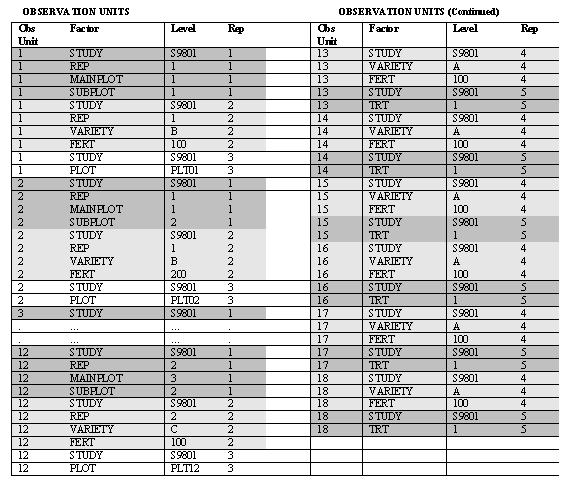
Figure 4.2.2 The DMS data model for ICIS
THE ICIS DMS SCHEMA
STUDY Table
The table with the research studies
| Field name | Description | Type | Length |
|---|---|---|---|
| STUDYID | Unique identifier of the Study. Link to the VARIATE and FACTOR table | Number (long) | 4 |
| SNAME | Working name of the study, e.g., 1998/brw/1 | Char | 50 |
| PMKEY | The program/project/activity which the study is related. Link to the Project Management Database | Number (long) | 4 |
| TITLE | The title of the study | Char | 255 |
| OBJECTIV | The objectives and hypotheses of the study. | Text | |
| INVESTID | The primary investigator of the Study. Link to the PERSONS table | Number (long) | 4 |
| STYPE | The type of the study. It can be Experiment, Nursery, Survey, Genotype, sMTA, Linkage Map Study , Transcript Expression Study. (E,N,S,G,M,L, T) | Char | 1 |
| SDATE | The date the study is started: YYYYMMDD | Number (long) | 4 |
| EDATE | The date the study is ended YYYYMMDD | Number (long) | 4 |
| USERID | The ID of the user who loaded the study | Number (long) | 4 |
| SSTATUS | The type of the stored record (if folder, 0; if study, 1) | Number (long) | 4 |
| SHIERARCHY | The parent folder of the study or folder | Number (long) | 4 |
VARIATE Table
The table of variates which are observed in the studies.
| Field name | Description | Type | Length |
|---|---|---|---|
| VARIATID | Unique identifier for a variate. Link to the DATA tables | Number (long) | 4 |
| VNAME | The name of the variate | Char | 50 |
| VTYPE | The type of the variate It can be a Measurement Variate, Derived Variate, or Summary
Variate. (MV, DV, SV) | Char | 2 |
| STUDYID | The study where the variate has been observed. Link to the STUDY table | Number (long) | 4 |
| TRAITID | The corresponding Property of the variate. Link to the TRAIT table | Number (long) | 4 |
| SCALEID | The corresponding scale, used for measuring the variate. Link to the SCALES table | Number (long) | 4 |
| TMETHID | The method of measuring the variate. Link to the TMETHODS table. | Number (long) | 4 |
| DTYPE | The type of the data recorded for the variate. It can be numeric, character or text
(N,C,T) | Char | 1 |
FACTOR Table
The table of factors being applied to the studies.
| Field name | Description | Type | Length |
|---|---|---|---|
| LABELID | Unique identifier for a label of a factor. Link to the LEVELS table | Number (long) | 4 |
| FACTORID | A number identifying the factor. Link to the LEVELS and OINDEX tables. | Number (long) | 4 |
| FNAME | The name of the factor | Char | 50 |
| STUDYID | The study where the factor has been applied. Link to the STUDY table | Number (long) | 4 |
| TRAITID | The corresponding Property of the factor. Link to the PROPERTYS table | Number (long) | 4 |
| SCALEID | The corresponding scale used for the factor. Link to the SCALES table | Number (long) | 4 |
| TMETHID | The method of measuring the factor. Link to the TMETHODS table | Number (long) | 4 |
| LTYPE | The data type of the levels of the factor. It can be number, character or text (N,C,T) | Char | 1 |
LEVEL Tables
Stores the different levels of a factor.
| Field name | Description | Type | Length |
|---|---|---|---|
| LABELID | The label of the level. Link to the FACTOR table | Number (long) | 4 |
| FACTORID | The factor wherein the level is one of its classifications Link to the FACTOR and
OINDEX tables | Number (long) | 4 |
| LEVELNO | The identification number of the level. Link to the OINDEX table | Number (long) | 4 |
| LVALUE | The value of the factor level. |
|
|
EFFECT Table
Stores the factor combinations which define effects and representations.
| Field name | Description | Type | Length |
|---|---|---|---|
| EFFECTID | The identification number for each EFFECT | Number (long) | 4 |
| FACTORID | The factor which is one of those that index the observation units in this effect.
Links to the FACTOR table. | Number (long) | 4 |
| REPRESNO | Indicates the factors involved in each representation of the current effect. | Number (long) | 4 |
OINDEX Table
Stores the combination of factor levels which defines an observation unit.
| Field name | Description | Type | Length |
|---|---|---|---|
| OUNITID | The identification number of an observation number. Link to the OBSUNIT table | Number (long) | 4 |
| FACTORID | The factor which is one of those that characterize the observation unit. Link to the
FACTOR table and LEVELS table | Number (long) | 4 |
| LEVELNO | Level of the specified factor. Link to the LEVEL table | Number (long) | 4 |
| REPRESNO | Representation of the same data by a different combination of factors and levels. | Number (single) | 2 |
DATA Tables (DATA_N, DATA_C, DATA_T)
Stores the observed, measured and derived data values.
| Field name | Description | Type | Length |
|---|---|---|---|
| OUNITID | The observation unit where the datum is measured. Link to the OBSUNIT table | Number (long) | 4 |
| VARIATID | The variate which describes the datum. Link to the VARIATE table | Number (long) | 4 |
| DVALUE | The data value |
|
|
DMSATTR Table
The definition table of attributes which describe the other DMS entities.
| Field name | Description | Type | Length |
|---|---|---|---|
| DMSATID | Unique identifier for a DMS attribute. | Number (long) | 4 |
| DMSATYPE | The type of the data attribute. Link to the DUDFLDS table. | Number (long) | 4 |
| DMSATAB | The name of the DMS table where the attribute applies. Link to the DUDFLDS table | Char | 10 |
| DMSATREC | The record id in the specified DMS table. | Number (long) | 4 |
| DMSATVAL | The value of the attribute. | Text | Memo |
DATATTR Table.
The definition table of attributes which describe the DMS entity DATA.
| Field name | Description | Type | Length |
|---|---|---|---|
| DATTRID | Unique identifier for a DATA attribute. | Number (long) | 4 |
| DATYPE | The type of the data attribute. Link to the DUDFLDS table. | Number (long) | 4 |
| DATABLE | The data table (DN, DC, DT) | Char | 2 |
| OUNITID | The observation unit id in the data table. | Number (long) | 4 |
| VARIATID | The variate id in the data table. | Number (long) | 4 |
| DATVAL | The value of the attribute. | Text | Memo |

