R-script for preliminary data analysis
From ICISWiki
Contents |
Downloading data
Data can now be downloaded from the virtualmendel server at UQ. Note that this site is under development and interface and functionality may change frequently.
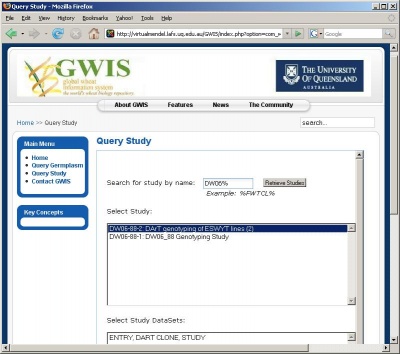
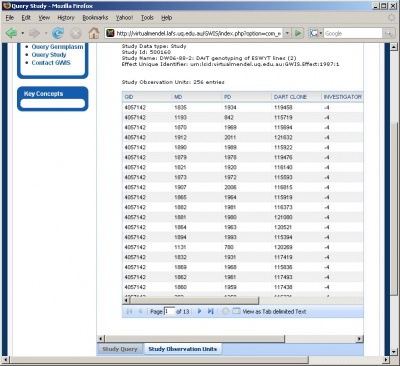
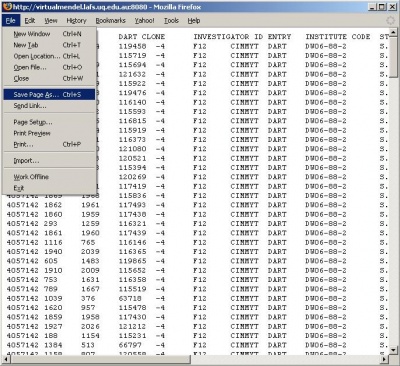
Retrieving and saving a local copy of a dataset in tab-delimited text format can be done in the three steps shown below.
Selecting a study and a dataset within the study
Retrieving the dataset within a study
Viewing and saving the retrieved dataset in tab-delimited text format
Reshaping the data
R script to reshape the downloaded DArT data
Tab-delimited text data as downloaded from virtualmendel
GIDMD   PD   DART  CLONE    INVESTIGATOR  ID   ENTRY ...
4057142   1835  1934   119458  -4      F12    CIMMYT ...
...
Reshaped data
entry TC117430 TC117438 TC117439 TC117493 wPt-0008 ...
  F12        1        0        0        1        0 ...
...
Preliminary data analysis
Background
Before conducting any detailed analysis, it is important to carry out a preliminary or exploratory data analysis. This analysis can help to pick up mistakes in the data or to discover unexpected data. Since we will dealing with large amounts of data, it is necessary to make the process as automatic as possible. Therefore, R-scripts are written to do this preliminary data analysis. In this case, three software applications will be used - Microsoft Access, Microsoft Excel, and R.
This R-script is written to handle data from the 25th cycle of the CIMMYT ESWYT (Elite Spring Wheat Yield Trial). It would require some modification to work with other data. However, if the data have been prepared or formatted like the ESWYT data, the modifications would be slight.
The data for running this script are obtained from Access queries. The graphical outputs are stored as pdf files, while tabular outputs are stored as csv files. For tables, the output from this R-script will require some formatting in Excel to produce nicer results.
Note: the term study, attribute and entry are used to make the terms more general. The example of those terms are as follows:
 *study = ESWYT, trial names, etc.
 *attribute = location or occurrences or traits, etc.
 *entry = genotype ID, entry number, location ID, observation value,etc.
R-script for creating occurrence table
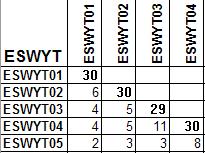
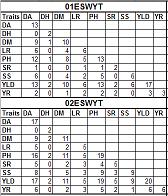
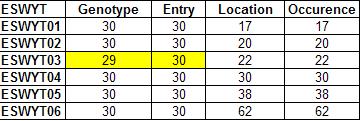
This R script will produce table with all upper diagonal are set as missing (only lower diagonal have values). It will calculated the number of the same entry within each pair of study. For example, it will calculate the number of genotype in every ESWYT and the number of the same genotype for each pair of ESWYT.
There are three type of occurrence tables: (1) occurrence table for all study, (2) occurence table for each study (3) relationship table of terms. Please see header of R-script for more explanation.
Sample outputs:
R-script for creating frequency histogram
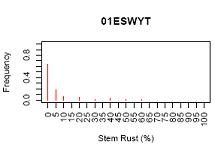
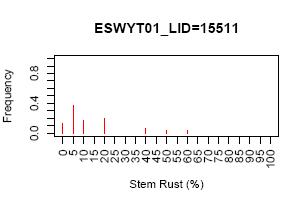
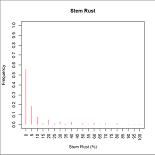
This R-script will produce frequency histogram. There are two type of frequency histogram: (1) for each study or study by attribute; (2) for all data accros study. The frequency are calculated in Access, R only does the plotting.
Sample outputs:
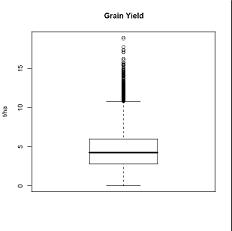
Note: Histogram for stem rust for each study and each study by location are only 1 example from many graphs. R-script will generated graph for each study and each study by location automatically and save all of them in 1 pdf file (ie. 1 pdf file for all frequency histogram of each study and 1 pdf file for histogram of study by location). Please, see the example of box plot.
R-script for creating boxplot
This R-script will produce box plot. There also two type of boxplot: (1) for each study or each study by attribute and (2) for all data accross study.
Sample outputs:
R-script for creating present-absent table for entry and its graphical representative
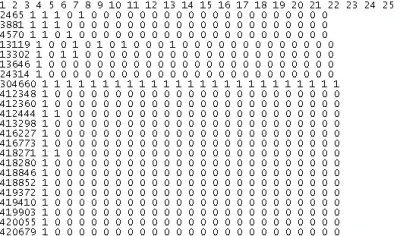
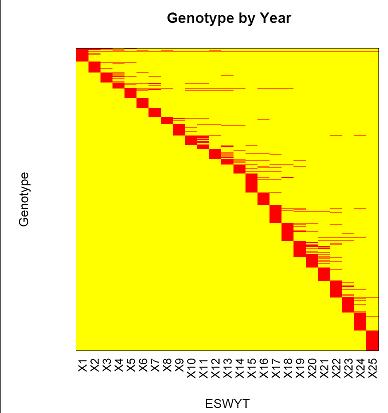
This R-script will produce present-absent table for entry (eg. genotype) by attribute (eg. year,location, etc.).The table will have value of 1 (present) and 0 (absent). When the number of entry and attribute are quite large (more than 30), it is difficult to show label in the graph. In this example, y-axis label (ie. genotypes) were sorted based on x-axis label (ie. year). The script also can sorted the x-axis label if required. The plot that showed is also a graphical representative of occurrence table of genotype (the first sampke output).
R script for present absent table and its plot
Sample outputs:
