TDM ICIS Workbook
From ICISWiki
ICIS WORKBOOK
INTRODUCTION
ICIS Workbook is a DMS application which connects an Excel spreadsheet to the DMS data structure to facilitate the loading and retrieving of data from the DMS. It is built as an add-in application to Excel and uses the DMS DLL to access a local and a central DMS database.
Definition of Terms
The Workbook uses a number of terms to represent the concepts that served as the framework for the design of the application. These terms are defined as follows:
- Study – is the basic, reportable unit of research; it is synonymous with the notions of experiment, nursery or survey
- Factor – is a classifying variable in a study which take a value from finite sets of discrete levels (e.g. Entries, Replication, Fertilizer applied)
- Condition – is a factor with a single level value (e.g. Location if single location trial)
- Variate – is a variable that is being measured or observed in the study (e.g. Grain Yield).
- Constant – is a variable that is measured only once in the study (e.g. Soil pH)
- Property – is a measurable characteristic of an experimental unit or experimental material that is manipulated or measured in a study.
- Scale – is a unit of measurement used in expressing a property.
- Method – is the manner a property is measured, observed or applied.
- Label – carries different information about the levels.
- Observation Unit – is a combination of the levels of one or more factors; it is equivalent to a row in a spreadsheet.
- Level – may be taken from a finite set of factor values that are uniquely identified.
- Effect – is a set of observation units in a study which are indexed by levels of subsets of the factors in the study.
The ICIS Workbook Structure
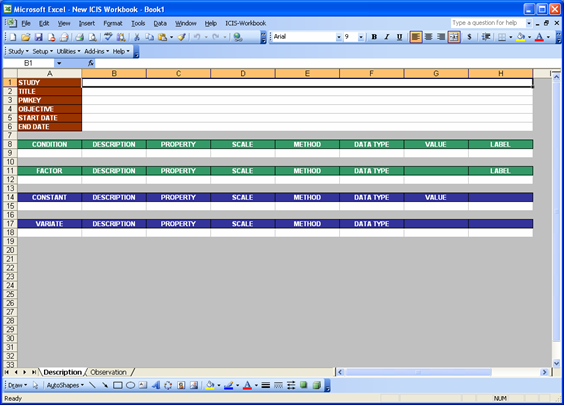
ICIS Workbook uses a formatted input file shown in Fig.1, which is created automatically when you click the Study ► New menu. It consists of two sheets: Description and Observation. The Description sheet is for entering information about the study and for describing the different variables used in the study while the Observation sheet is for entering the data gathered from the study.
Fig. 1. ICIS Workbook Input File (showing the Description sheet)
Description Sheet
The Description sheet is divided into five sections: STUDY, CONDITION, FACTOR, CONSTANT, and VARIATE. Each of this section has a corresponding named range of cells which are defined automatically along with the creation of the input file.
The STUDY section has six rows with two columns each. The first column contains the row labels while the second column is where you enter the corresponding row values. The six rows are labeled as STUDY, TITLE, PMKEY, OBJECTIVE, START DATE, and END DATE. The STUDY row contains the name of the study that uniquely identifies each study in the database. If you intend to load a new study to the database, be sure to check first if that name doesn’t exist yet. Otherwise, the content of your new study will only be merged to an existing study in the database that has the same name.
The CONDITION, FACTOR, CONSTANT, and VARIATE sections have a fixed width of eight columns while their height could possibly vary depending on the number of variables used. The Condition section makes use of the full eight columns as indicated by the column names. The Factor section uses only seven as well as the Constant section while the Variate section uses only six. All four sections initially have two rows upon creation of the input file. The first row contains the column labels while the succeeding row is where you enter the corresponding column values. To accommodate the number of variables you intend to use in each of the four sections, insert additional rows after the last (white) row of the section.
The first column label for the four sections contains the name of the section. This is where you enter the variable (condition, factor, constant, or variate) names that you use in the study. The second column is labeled as DESCRIPTION. Here, you can completely describe the variable name used or put any remark about the variable. The third, fourth, and fifth columns are for the PROPERTY, SCALE, and METHOD or what is called the ontology of the variable used. The sixth column is for the DATA TYPE and may only contain two possible values recognized by the system, either “C” for character or “N” for numeric. The seventh column called VALUE is only found under the Condition and Constant sections while the eighth column called LABEL exists only in the Condition and Factor sections.
Observation Sheet
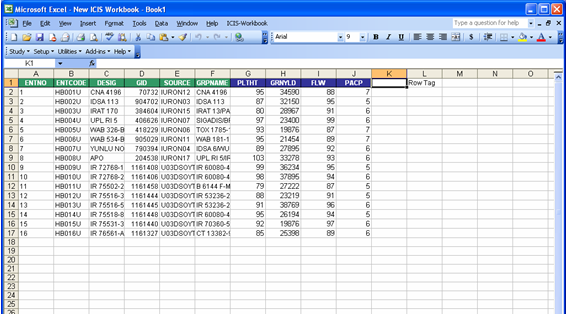
The Observation sheet is initially blank upon the creation of the input file. However, using the Setup ► Sheet ► Observation menu, the factors and variates defined in the Description sheet are automatically assigned as column headings in the Observation sheet (Fig.2). Moreover, succeeding the last variate column of the Observation sheet is a blank column and next to it is a named column called ROWTAG. Any mark under this column would render the corresponding row as a comment and will be ignored during the loading of the observations to the database. A corresponding named range is also automatically created and is used by the system to refer to this column.
Fig. 2. Observation sheet (with observations already filled-in)
Multiple Representations
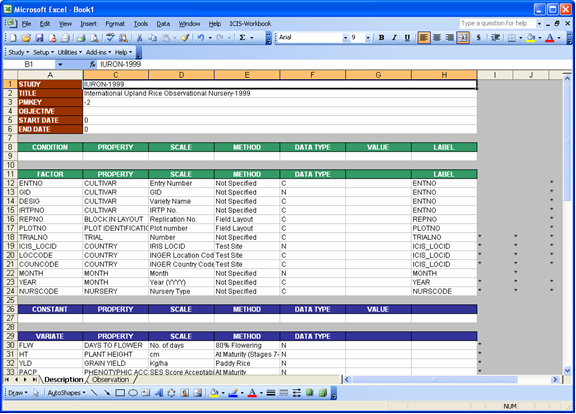
If a study contains multiple representations for the same effect, you can show the different representations as columns after the LABEL column. Under the column that refers to a particular representation, mark with asterisk (*) or any character the factors and variates that you want to include in that representation. A temporary name can be given for the representation but it will not be stored in the database, rather the system assigns a number for the representation.
Fig. 3. Multiple Representations of an Effect
Parallel Dataset
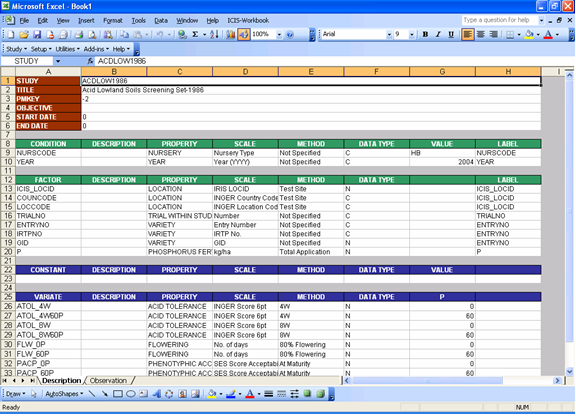
The Workbook accommodates a dataset arranged in a parallel manner. A parallel factor is one whose levels are associated with individual columns in the Observation sheet. The factor is specified in the FACTOR section in the usual way but its name should be entered on the column following the DATA TYPE column in the VARIATE section of the Description sheet. Enter its level values under that column on the row of the associated variate as shown in Fig.4.
Fig. 4. Parallel Dataset
ICIS WORKBOOK MENU
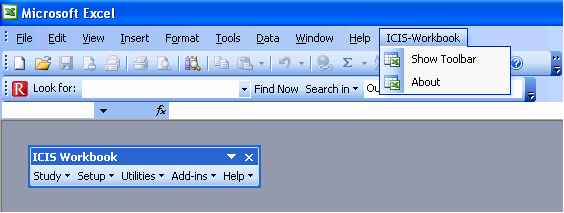
Upon launching the Workbook, a menu item labeled ICIS-Workbook is added to the main menu of Excel. It contains two submenus, namely, Show Toolbar and About. Show Toolbar displays the ICIS Workbook menu which contains five menu groups: Study, Setup, Utilities, Add-ins, and Help.
Fig. 5. ICIS Workbook Menu
Study Menu Group
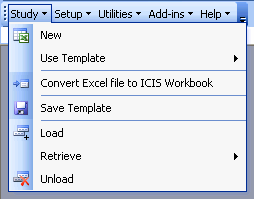
The Study menu group offers three ways to enter data to the DMS database: (1) starting from an empty ICIS Workbook input file, (2) using a pre-formatted ICIS Workbook template, or (3) converting an existing Excel file with tabular data to the ICIS Workbook format. It also offers utilities to create ICIS Workbook template files and to upload, retrieve, and delete studies from the DMS database.
Study → New Menu
The Study → New menu creates an ICIS Workbook input file with a formatted Description sheet and a blank Observation sheet. The user has two options to start with:
Starting from the Description sheet:
- Input variable names under the condition, factor, constant, and variate sections.
- Use either the Setup → Variable Section → Express or Custom Setup menu to define the variables.
- Use the Setup → Observation Sheet menu to create the corresponding Observation sheet.
Starting from the Observation sheet:
- Input factor and variate names on the first row of the Observation sheet.
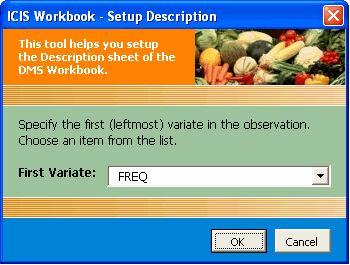
- Use the Setup → Description Sheet menu to create the corresponding Description sheet.
* You will be asked to specify the first variate.
* The system automatically assigns default variable definitions. - Modify the default variable definition as you like.
The order of the variables in the sheet that you started with is the basis for the ordering of the variables in the other sheet. In cases where you wish to change the order or add or delete variables, just re-run the corresponding setup sheet menu to make the two sheets coincide with each other. Note that if there are already observations entered in the Observation sheet or ontology defined in the Description sheet, reordering the variables keeps your existing data.
Study → Use Template Menu
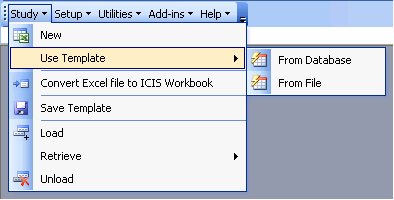
The Study → Use Template menu offers two possible sources of template: (1) from the database, or (2) from a file.
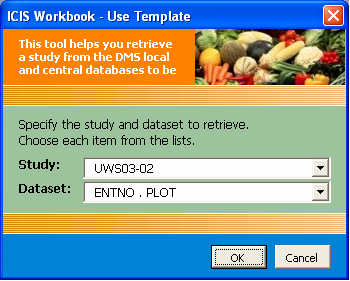
Study → Use Template → From Database Shows a list of studies and datasets from the local and central DMS databases for the user to select, then creates an ICIS Workbook template containing the corresponding variable definitions but without the observation data.
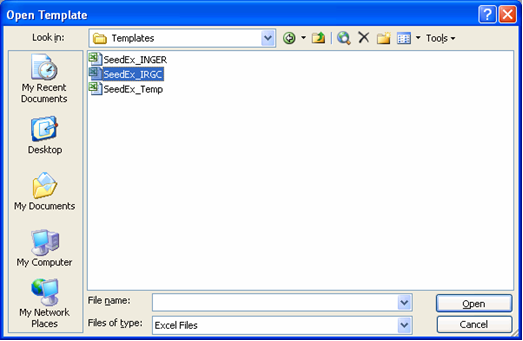
Study → Use Template → From File Shows the Windows Open Dialog interface for the user to browse the location of a previously saved ICIS Workbook template file.
Study → Convert Excel file to ICIS Workbook Menu
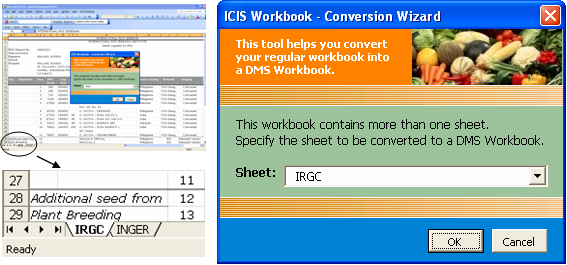
The Study → Convert Excel File to ICIS Workbook menu converts an Excel sheet with a tabular data into an Observation sheet then creates the corresponding Description sheet. A Conversion Wizard guides you along the way.
Step-by-Step Procedure:
- Open the Excel file that you wish to convert. If your Excel file contains more than one sheet, you must specify which sheet to process.
- Specify which row contains the column headings, the first row of observation, and the number of observations. There are two ways to specify the number of observations. Either you identify an index column (no blank cell in between the first and last observation) and the total number of observations is automatically determined, or you directly specify the number in the box provided.
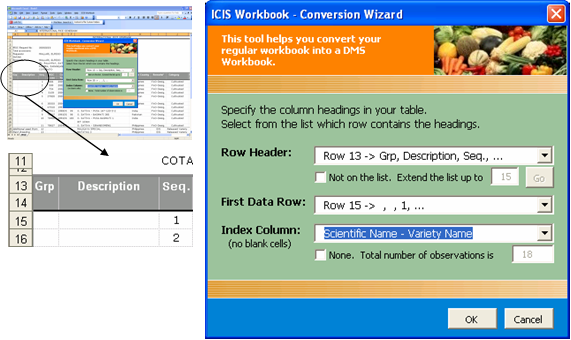
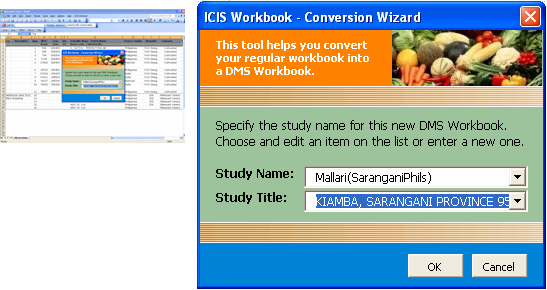
- Specify the study name and title. The list of possible study name and title includes the name of the file, the name of the worksheet, and the data stored in the cells before the row header.
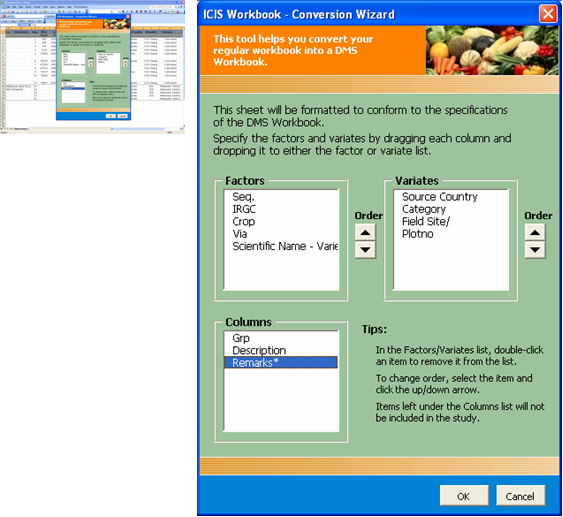
- Specify which of the column headings are factors and which of them are variates. As soon as you specify the factor and variate columns, all other columns that were not classified will be left behind.
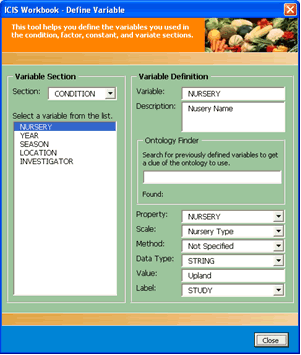
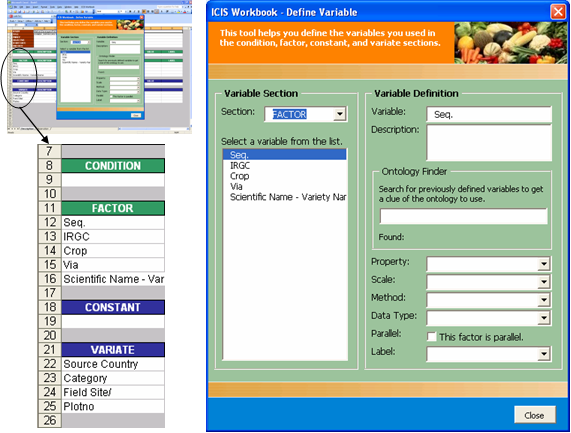
- Define the variables. The dialog interface shows one variable section at a time (CONDITION, FACTOR, CONSTANT, VARIATE). Thus, select first the section where the modifications will be made. After which, the list of variables under that section will be displayed. Select a variable from the list and the information regarding that variable will be shown at the right side of the interface. There the necessary changes can be made. In case the user has no idea of what ontology to use, there is a tool called the “Ontology Finder” that offers some help. Just type-in the name of the variable in the search box and it tries to find a suitable ontology in relation to previously defined variables in the database. On the other hand, if the user knows which ontology to use, the dropdown list for the property, scale, method, and data type offers choices. Or, if the list is a bit long and tiresome to scroll down, the user can simply type-in the value and the program automatically searches for the item in the list.
After doing these steps, a new ICIS Workbook will be created containing the data from the Excel file.
Study → Save Template Menu
The Study → Save Template menu saves the currently opened study to a file with the variable definitions but without the observation data.
Study → Load Menu
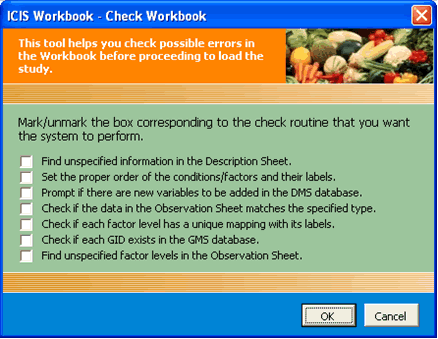
The Study → Load menu performs data integrity checking and uploads the content of the current ICIS Workbook to the DMS local database.
Checks Performed:
- Checks for unspecified but required data and sets default values if possible.
- Checks that true factors come before their label factors, re-orders them if needed, and fills-in unspecified labels accordingly.
- Checks for the existence in the database of the specified ontology and prompts the user for confirmation on either to add the new ontology or use a defined one.
- Checks if the data in the Observation sheet corresponds with the specified data type in the Description sheet.
- Checks for the unique mapping of the values of the true factors with the values of their corresponding label factors.
- Checks if the GIDs specified exist in the local and central DMS databases.
- Checks for unspecified factor levels.
Study → Retrieve Menu
The Study → Retrieve menu offers two possible retrieve options: (1) retrieve factors and variates for all datasets, or (2) retrieve the study information for a specified dataset.
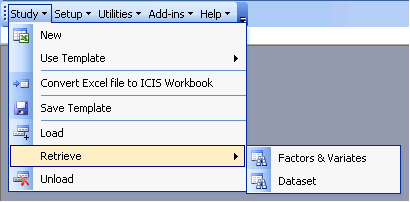
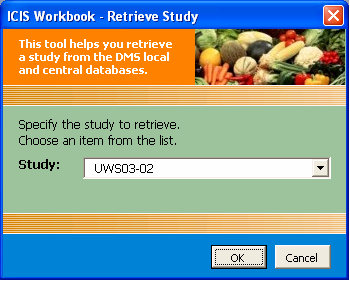
Study → Retrieve → Factors & Variates Retrieves a study from the local or central DMS database and displays the information in the Description sheet with all the datasets combined.
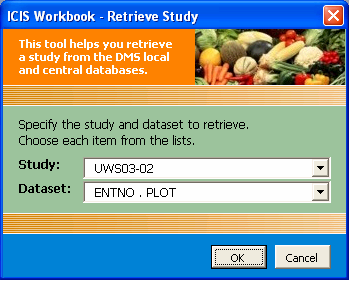
Study → Retrieve → Dataset Retrieves a study from the local or central DMS database and displays the information in the Description sheet and the observation data in the Observation sheet based on the specified dataset.
Study → Unload Menu
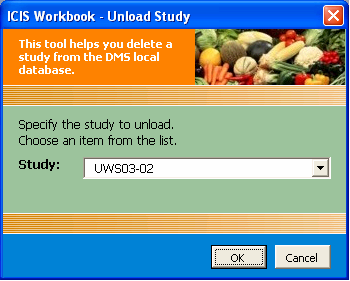
The Study → Unload menu removes the specified study from the local DMS database.
SETUP MENU GROUP
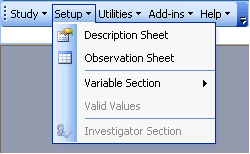
The Setup menu group offers alternative ways to start creating the ICIS Workbook. If the user wants to start by entering the observations in the worksheet, he/she can later on create the Description sheet based on the Observation sheet. On the other hand, if the user wishes to define first the variables to be used in the study, he/she can then create the Observation sheet based on the Description sheet. It also provides various tools to define the variables used in the study.
Setup → Description Sheet Menu
The Setup → Description Sheet menu creates the corresponding Description sheet based on the column headings defined in the Observation sheet.
Setup → Observation Sheet Menu
The Setup → Observation Sheet menu creates the corresponding Observation sheet based on the variables defined in the Description sheet.
Setup → Variable Section Menu
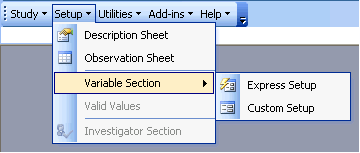
The Setup → Variable Section menu provides the user with two other ways to define the ontology of the variables used in the study aside from the fact that the user can directly type the ontology into the corresponding cells of the worksheet.
Setup → Variable Section → Express Setup
The Setup → Variable Section → Express Setup menu fills all blank property, scale, method, and data type with default values based on the first match that the program finds in the local or central DMS database. Otherwise, it returns an empty string.
Setup → Variable Section → Custom Setup
The Setup → Variable Section → Custom Setup menu launches a variable definition dialog interface where the user can select from the list of already defined ontology in the local and central DMS databases.
Setup → Valid Values Menu (coming soon)
The Setup → Valid Values menu allows the user to define a range or a list of values for a variable.
Setup → Investigator Section Menu (coming soon)
The Setup → Investigator Section menu gives the user the functionality to define investigator information.
UTILITIES MENU GROUP
The Utilities menu group provides the functionalities that are seldom used in the usual day-to-day operations but are always there the moment they are needed.
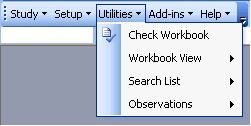
Utilities → Check Workbook Menu
The Utilities → Check Workbook menu offers the user with the option to perform individual checking procedures before attempting to load the data.
Utilities → Workbook View Menu (coming soon)
The Utilities → Workbook View menu allows the user to customize the way the Workbook template is displayed by hiding or showing rows and columns.
Utilities → Workbook View → Administrator View
Shows all the rows and columns in both the Description and Observation sheets.
Utilities → Workbook View → Encoder View
Hides the Property, Scale, Method, Data Type, and Label columns in the Description sheet, as well as the Factor and Variate Sections (rows). Shows only the Study Section and parts of the Condition, and Constant Sections where the user needs to enter values.
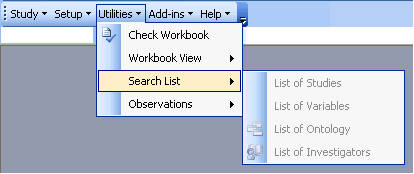
Utilities → Search List Menu (coming soon)
The Utilities → Search List menu allows the user to browse the lists of studies, variables, ontology, and investigators in the local and central databases.
Utilities → Search List → List of Studies
Shows the list of loaded study information in the local and central DMS databases.
Utilities → Search List → List of Variables
Shows the list of already defined variable names in the local and central DMS databases.
Utilities → Search List → List of Ontology
Shows the list of available properties, scales, and methods that are in the local and central DMS databases.
Utilities → Search List → List of Investigators
Shows information on investigators that are loaded in the local and central DMS databases.
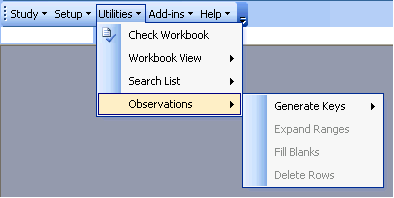
Utilities → Observations Menu (coming soon)
The Utilities → Observations menu provides the user with small functions to manipulate the entries in the Observation sheet.
ADD-INS MENU GROUP
The Add-ins menu group is the Workbook’s link to other applications within or possibly outside the ICIS platform.
Add-ins → Import Data From Menu
The Add-ins → Import Data From menu enables the user to retrieve data coming from the germplasm lists as well as from previous studies.
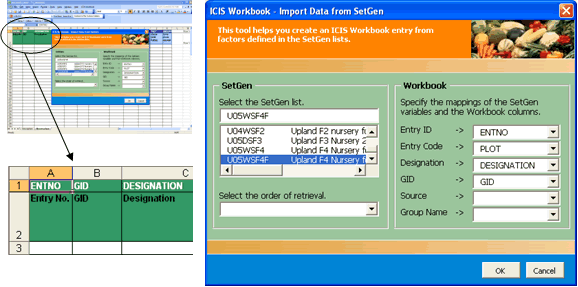
Add-ins → Import Data From → SetGen
The Add-ins → Import Data From → SetGen menu launches a dialog interface to get the necessary information and downloads the SetGen columns (EntryID, EntryCode, Designation, GID, Source, GroupName) based on the specified List Name and the mapping of SetGen columns to available factor columns in the Workbook.
If there is an open ICIS Workbook, the program searches for defined SetGen ranges in the workbook and displays the mapping match in the dialog box. In case such ranges are missing, the program tries to find which of the factor columns are most likely to be the user’s choice for the mapping and displays its suggestions. If there is no open ICIS Workbook, the program simply creates a new one with the downloaded SetGen information.
Add-ins → Import Data From → Old Studies (coming soon)
The Add-ins → Import Data From → Old Studies menu allows the user to retrieve columns of data coming from other studies and copy them to the current study.
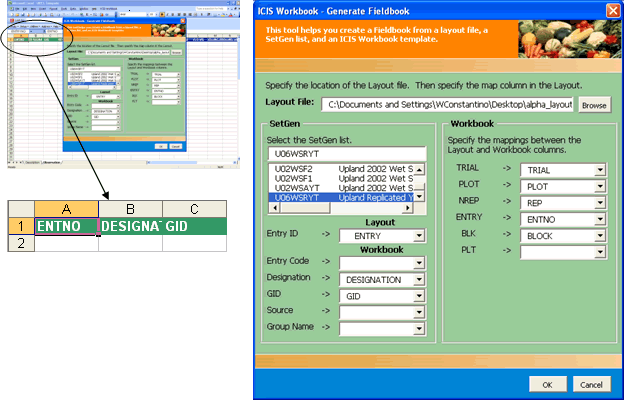
Add-ins → Generate Fieldbook Menu
The Add-ins → Generate Fieldbook menu launches a dialog interface to get the necessary information and creates a Fieldbook based on the specified SetGen List, a Layout File and a Workbook Template.
If the Layout File contains a column that was specified as a condition, an ICIS Workbook will be created for each of the unique values under the condition column. If there are many columns specified as conditions (up to 9), multiple ICIS Workbooks will be created based on the combination of the condition values.
