TDM Data Comparison Tool 5.5
From ICISWiki
S.M. Yates, Agriculture and Agri-Food Canada
Contents |
Introduction
The Data Comparison Tool was created to work with the International Crop Information System (ICIS), as a tool to help query the breeding data stored within ICIS and output it into a useful format. It is available for all ICIS users who are interested in using it. While it was developed primarily for wheat breeding programs at Agriculture and Agri-Food Canada (AAFC), the intention was that it would work with most ICIS implementations.
Thank-you to everyone who has contributed to the development, testing and technical assistance that went into creating this application. Please refer to the “About” page on the main menu for a list of individual contributors.
Please report any errors, bugs or feature requests to Shawn Yates or on the CropForge Data Comparison Tool page.
Main Menu
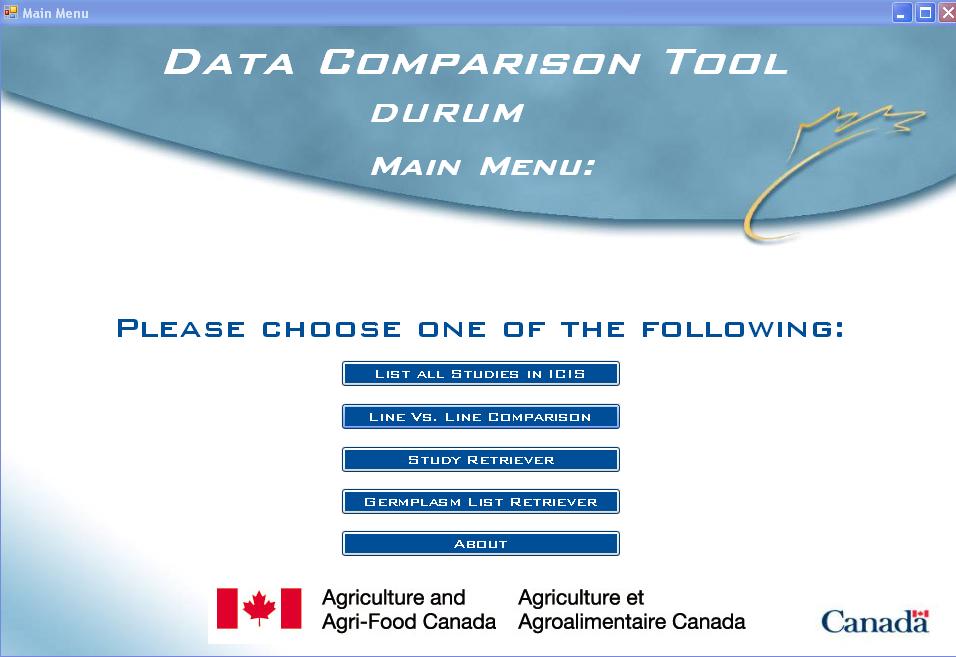
Fig. 1. Data Comparison Tool Main Menu
The main menu allows the user to choose between 5 main queries and an About screen:
- List All Studies in ICIS - produces a list of all studies in the Central and Local databases for the chosen crop.
- Line Vs. Line Comparison - allows users to create an output of data on particular lines that might be of interest. This query will only include studies in which all entered lines are present.
- Study Retriever - allows users to create an output of data for a particular DMS study that might be of interest.
- Germplasm List Retriever - allows users to create an output of data on the lines in a germplasm list (created in SetGen) that might be of interest.
- About - information about the version and collaborators
List All Studies in ICIS
This query will produce a list of all studies that are currently in the Central and Local databases for the selected crop.
List Studies Screen (without genotypic database)
If no genotypic database is present, the studies list will be automatically generated for both the Central and Local databases.
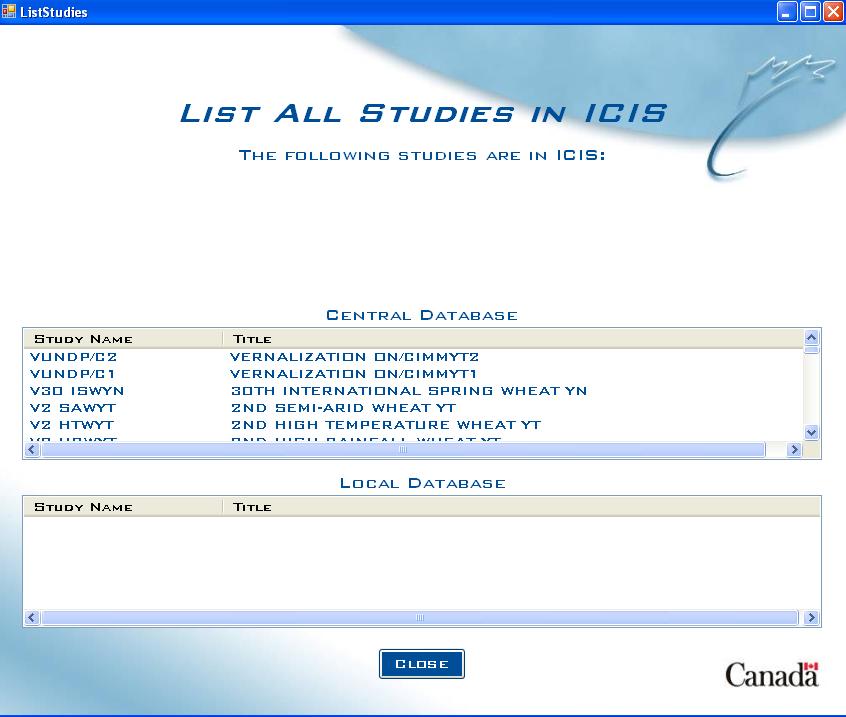
Fig. 2. List Studies Screen with no gentoypic database present
List Studies Screen (with Genotypic database)
If there is a genotypic database present, then the user must specify which set of databases they wish to query (phenotypic or genotypic).
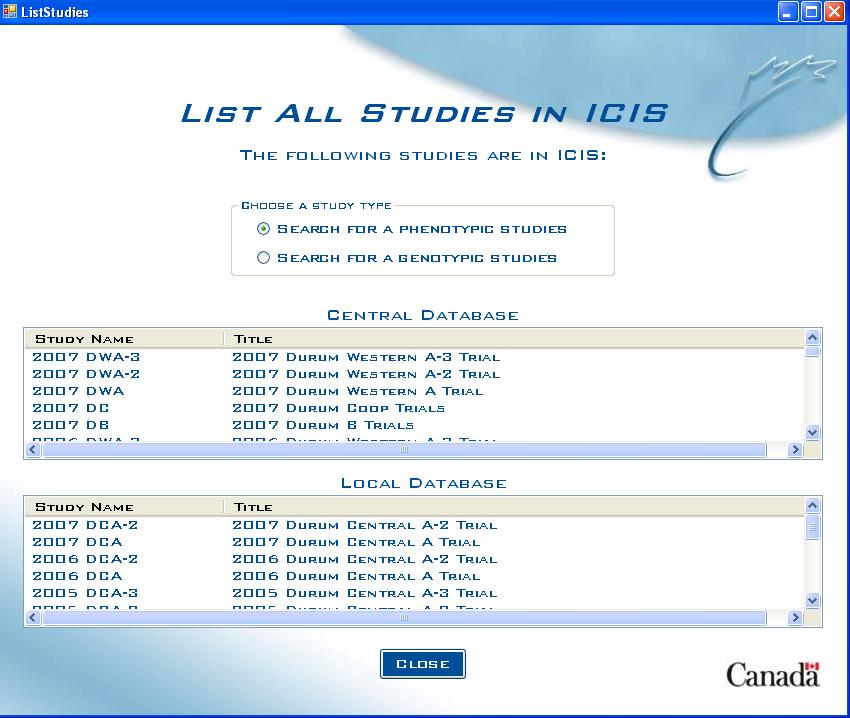
Fig. 3. List Studies Screen with genotypic database present
Line Vs. Line Comparison
The Line vs. Line Comparison allows users to create an output of data on particular lines that might be of interest. This query will only include studies in which all entered lines are present. The user has the ability to choose which Factors and Traits they wish to include in the output and also have options to include check data and genotypic data (if available).
Line Entry Screen
Start by adding lines to the query:
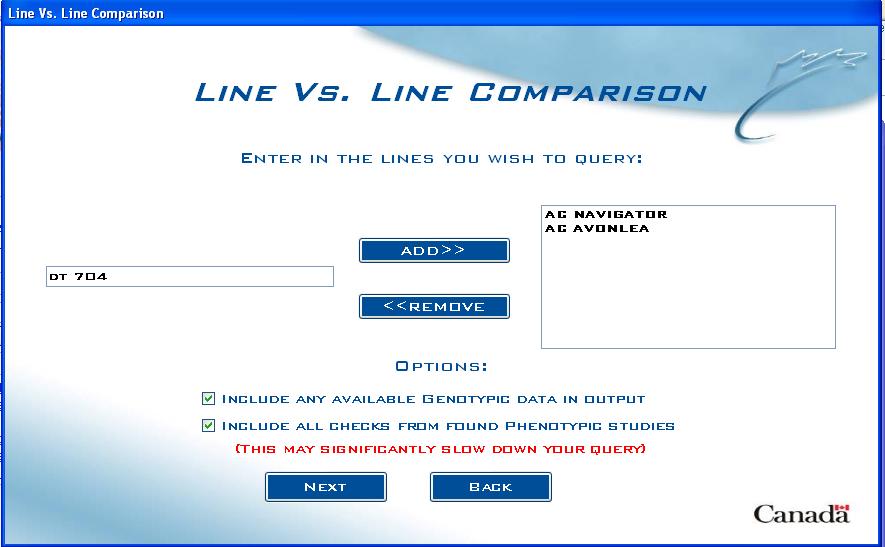
Fig. 4. Line Vs. Line Comparison entry screen
Type the line name into the text box on the left and click on ADD>> to move it to the list box on the right. Any entered lines can be deleted from the query by highlighting them in the list box on the right and clicking on <<REMOVE. While there is no limit to the number of lines that can be added to the query, the user should keep in mind that each line added will increase the time it takes for the query to complete.
Options
If the DATACOMP section has been added to the .ini file, the following options may be available:
- Include any available genotypic data in output - By checking this option, the query will also search the molecular databases for any genotypic data available for the lines entered.
- Include all checks from found phenotypic studies - By checking this option, for each study the entered lines are present in, the query will also include all checks from that study.
Note: by selecting this option, the query time may be greatly increased, due to the extra work required in determining the checks and gathering data for them.
Study Retriever
The Study Retriever allows users to create an output of data for a particular study that might be of interest. The user has the ability to choose which Factors and Traits they wish to include in the output and also have options to include genotypic data (if available).
Study Choice Screen (without genotypic database)
Start by choosing which study to query:
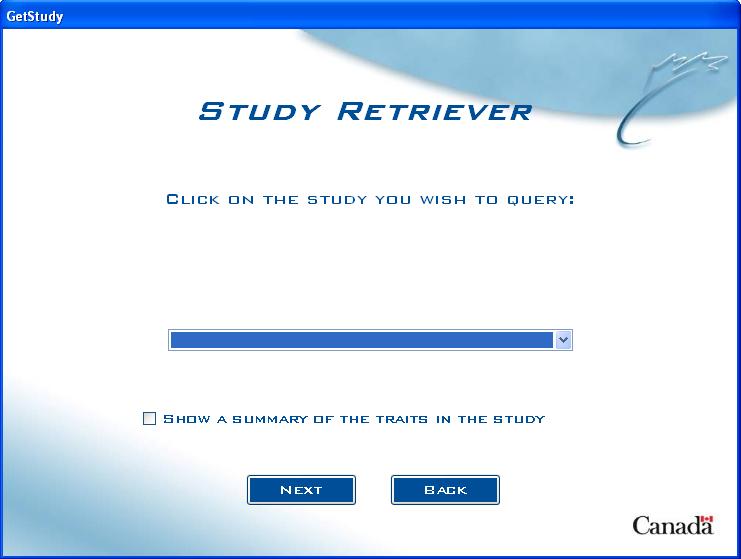
Fig. 5. Study Retriever choice screen without genotypic database present
Click on the arrow in the drop-down box to show the list of studies to choose from, or the user can also type the first number or letter of the study name to jump to all studies starting with that letter or number.
Study Choice Screen (with genotypic database)
If there is a genotypic database present, the user must choose which type of study they wish to query (phenotypic or genotypic):
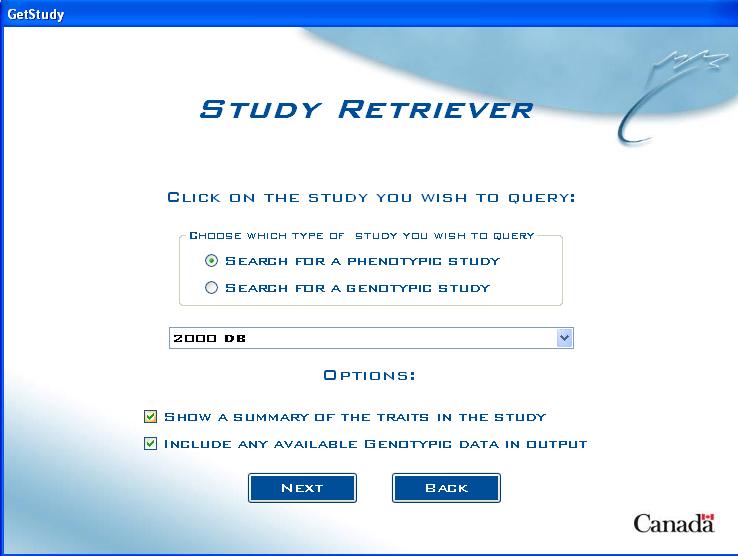 Fig. 6. Study Retriever choice screen with genotypic database present
Options
- Show a Summary of the Traits in the Study - by checking this option, the query will produce a list of all Factors and Variates that are associated with the chosen study.
If the DATACOMP section has been added to the .ini file, the following option may be available:
- Include any available genotypic data in output - By checking this option, the query will also search the molecular DMS databases for any genotypic data available for the lines entered.
Study Variables Screen
If the user selects the option to Show a Summary of Traits in the Study, the Study Variables Screen will appear and generate a list of all Factors and Variates associated with the chosen study.
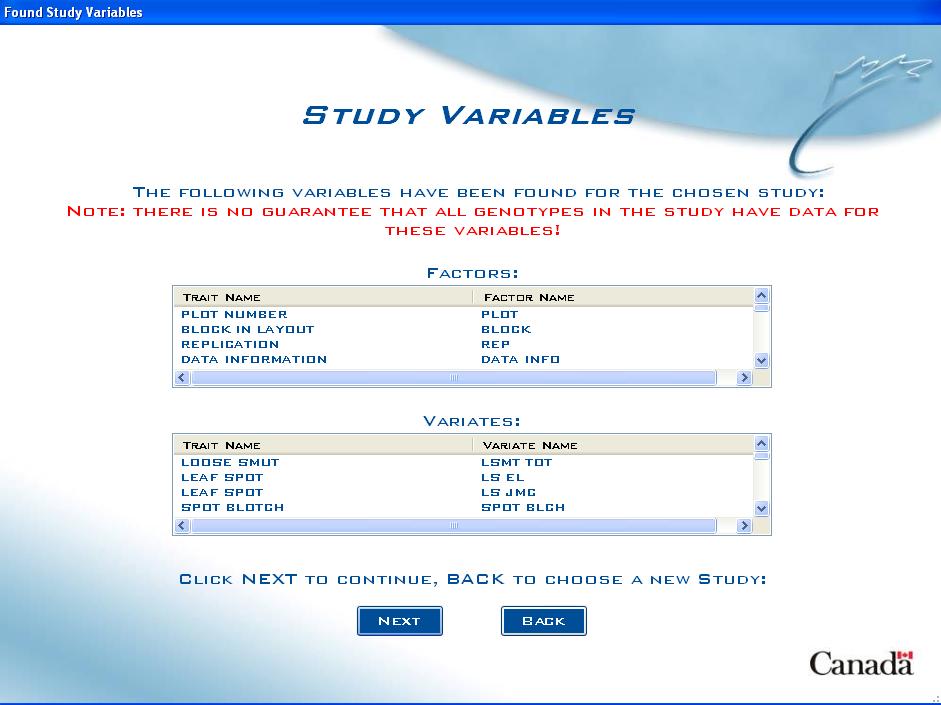
Fig. 7. Study Variables Screen
It is important to recognize that while the listed Factors and Variates relate to the chosen study, there is no guarantee that the data pertains to all genotypes in the study. For example, while Grain Yield might be measured in the study, it may only be measured on selected genotypes.
From here, the user can click NEXT the continue or BACK to choose a new study.
Study Index Screen
Not all studies in ICIS are germplasm studies. Some may refer to location information, farmer's incomes, etc. In these special cases, the user will have to choose what the main index of the study is. For example, Location ID for location data or Farmer ID for farmer incomes.
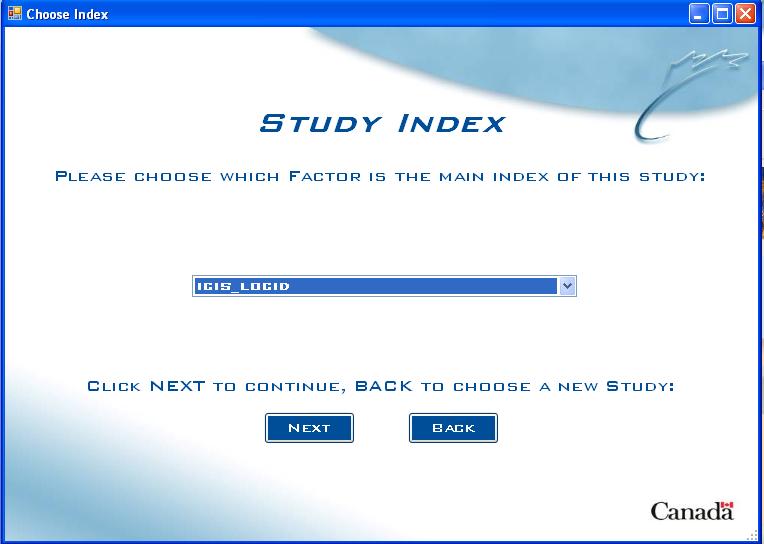
Fig. 8. Study Index Screen
The user chooses the study index from the list of all Factors in the drop down list. The user then clicks NEXT to continue, or BACK to choose a new study.
Germplasm List Retriever
The Germplasm List Retriever allows users to create an output of data on the lines in a germplasm list that might be of interest. The query can also create an output of which studies the lines appear in, to help the user narrow down their focus. In addition, the user also has the ability to choose which Factors and Traits they wish to include in the output and also have the option to include genotypic data (if available).
Note: Germplasm lists are created using the ICIS SetGen Application. For more help on creating a list of germplasm, please reference the help manual for SetGen.
Germplasm List choice screen
Start by choosing which Germplasm List to query:
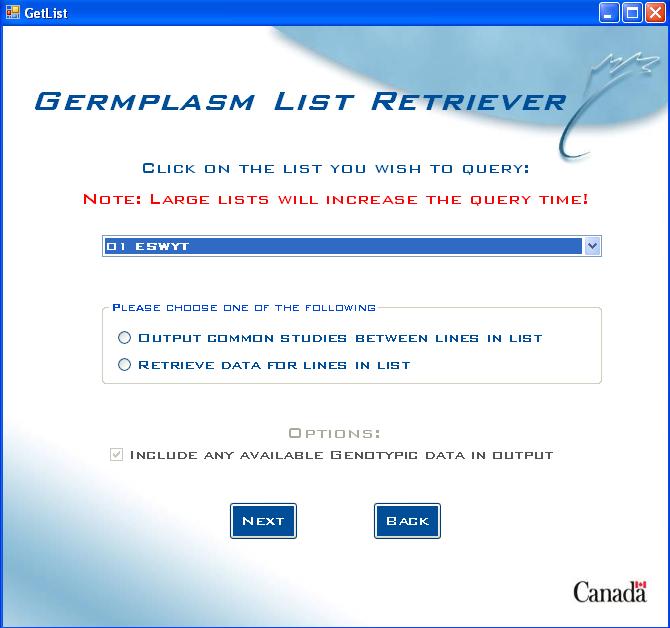
Fig. 9. Germplasm List Retriever choice screen
Click on the arrow in the drop-down box to show the germplasm lists to choose from, or the user can also type the first number or letter of the germplasm list name to jump to all lists starting with that letter or number.
Options
- Output Common Studies Between Lines in List - In germplasm lists that contain a large number of lines, it might be useful to first see which studies they appear in to find common studies, depending on the user’s interests in the data.
- Retrieve Data For Lines in List - query for data on the lines in the list.
If the DATACOMP section has been added to the .ini file, the following option may be available:
- Include any available genotypic data in output - By checking this option, the query will also search the molecular DMS databases for any genotypic data available for the lines entered.
Common Screens
The following, in order of appearance, are screens that are common to all queries:
Duplicates screen
If more than 1 GID is found for a germplasm in the query, the Duplicates screen allows the user to choose the correct one:
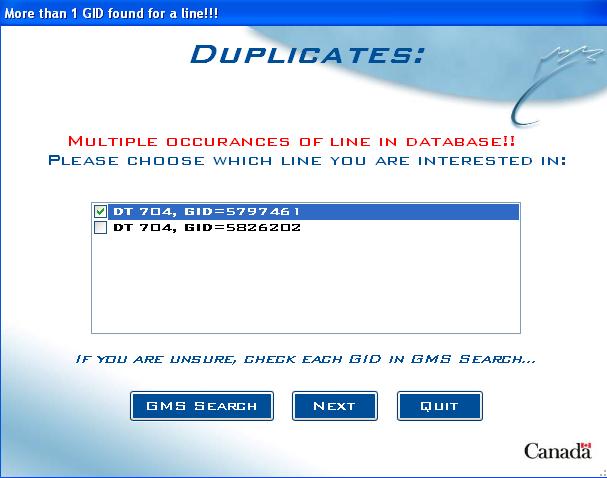
Fig. 10. Duplicates screen example
The duplicate names are listed, along with their corresponding GIDs. The user is asked to choose which GID is the correct one for their query. If unsure, the user can click on "GMS SEARCH" to launch the GMS Search application to help decide which GID to use.
Factors screen
In this screen, the user can choose which Factors they want to include in the output:
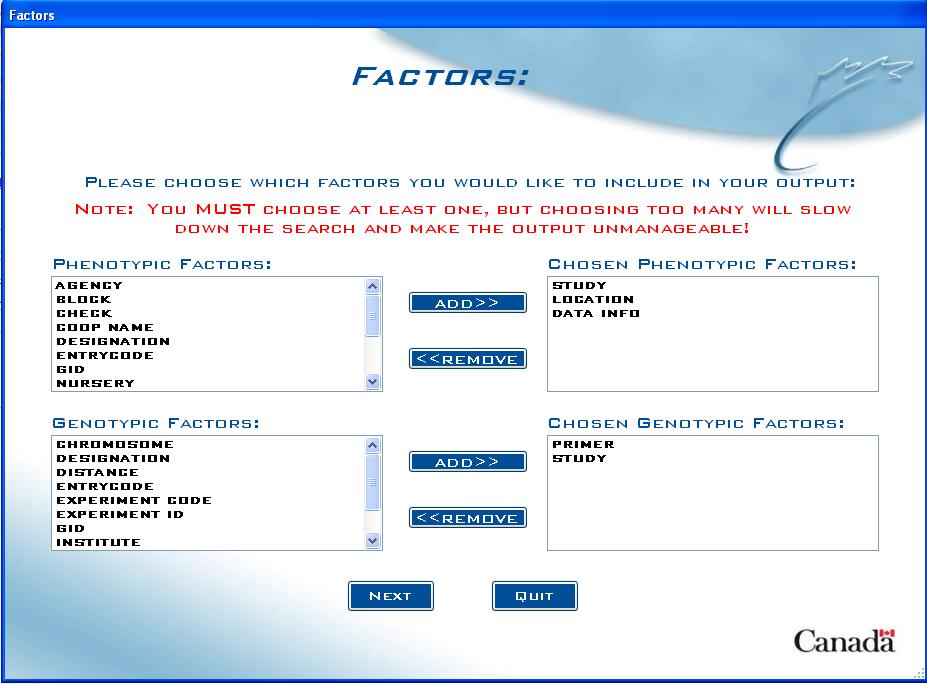
Fig. 11. Factors screen example
The top list box on the left includes found Phenotypic Factors from all studies that the entered lines are present in. If the option to include genotypic data was selected, there will also be a Genotypic Factors box underneath with all found factors from genotypic studies that the entered lines are present in.
The user must choose at least one factor from each box on the left in order to continue, by selecting a factor and clicking on ADD>>. Depending on which factor names have been used in loaded studies, users may see some factors already selected in the box on the right. These are suggested factors and can be removed by selecting them and clicking on <<REMOVE.
Note: Selecting too many factors can make the output unreasonable and may slow down the query, so it is important to carefully choose factors that make sense for the user’s purposes (i.e “REP” and “Plot” for plot data).
Data Filters screens
Depending on the size of your dataset, it may be useful to set up filters for the output. For example, a study that is replicated over numerous environments can produce a very large dataset and the user may only be interested in a portion of that dataset (i.e. all data at a certain location).
Data Filters screen
Setting up a filter is a two-step process:
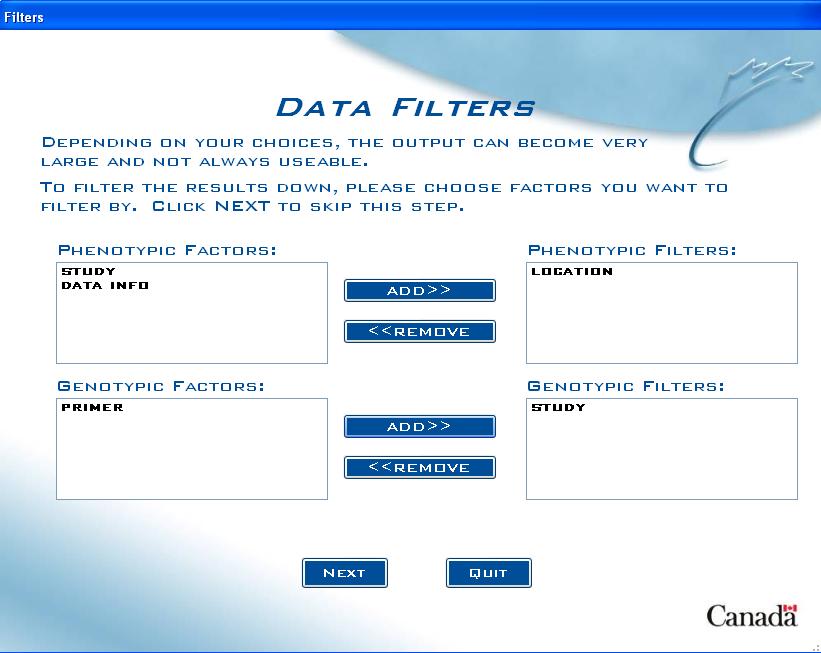
Fig. 12. Data Filters screen example
The first step is to include which factors to filter by, so in the previous example, the user would select "Location" from the list box on the left, which has all the chosen factors listed. The user would then click on ADD>> to move the factor to the Filters list box.
If the option for including genotypic data was selected, all genotypic factors chosen will be in a list box directly below. The same process is repeated for genotypic filters.
Note: A maximum of 4 filters can be chosen (2 Factors with a numeric data type and 2 factors with a character data type).
Dataset Filter screen
Now the user must choose the specific criteria for their filter:
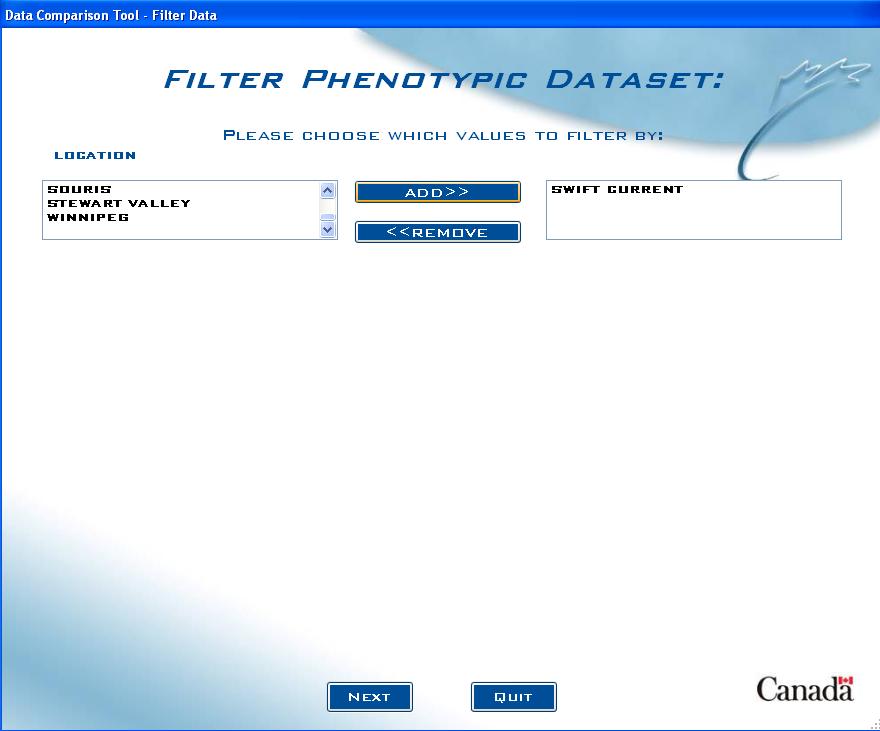
Fig. 13. Dataset Filter screen example
The list box on the left (or list boxes, depending on how many filters were chosen) includes all the values for the factor chosen. In the example above, “Location” was chosen to be a filter, so all locations associated with the entered lines are in the list box. Choose the filter criteria from the list box on the right and click on ADD>> to add it to the criteria list box on the right.
If the option to include genotypic data was selected, a similar screen will appear after the user clicks Next. Follow the same process for that screen as well.
Note: When choosing criteria, it is important to be aware that selecting too many choices may accidentally filter out all values in your dataset. For example, if the user chose to filter all data using the Study "2002 DC" and the Location "Swift Current" as criteria, but if Swift Current was not in 2002 DC study, there would not be any results. It is best to only choose 1 or 2 filters at first, until there is a sufficient feel for the dataset and then re-run the query with more filters to avoid this situation.
Traits screen
The Traits (also defined as Properties in the DMS) screen allows the user to choose which measured variables they want to include in the output:
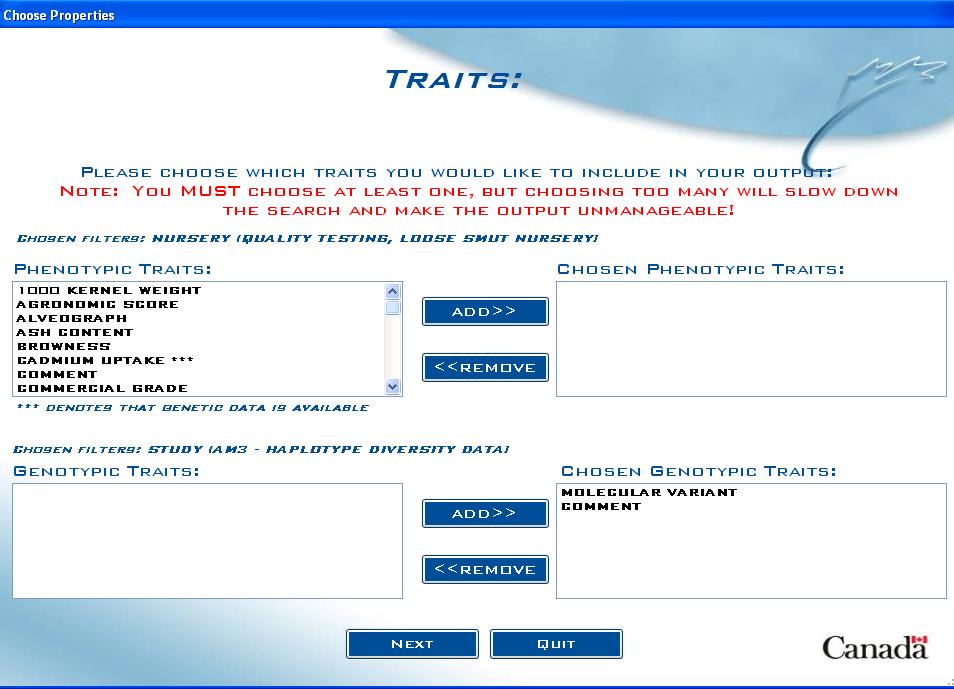
Fig. 14. Traits screen example
The list box on the left contains all traits that were present in the DMS Studies found for the entered lines. This list of traits does not take into account any filters that the user may have put on the dataset. For example, if the user restricted output to a certain Study, traits from other found studies would still be present in this list, and if chosen, would not produce any results.
If the option was selected to include genotypic data, a similar list box for the genotypic traits will appear just below the phenotypic list box. Follow the same process to select the genotypic traits. Also, in the phenotypic list box, any available genotypic data that is associated with phenotypic traits will be indicated by a *** next to the phenotypic trait name. In the example above, there was genotypic data related to Cadmium Content available, so the phenotypic list box displayed CADMIUM UPTAKE ***.
Note: Selecting a vast number of traits will greatly increase the amount of time the query takes to complete, and may make your output hard to follow. Only select the traits that you are interested in.
Save Output Screen
Once the query has completed, the user will see a screen asking to save the output as an Excel file, text file or XML spreadsheet:
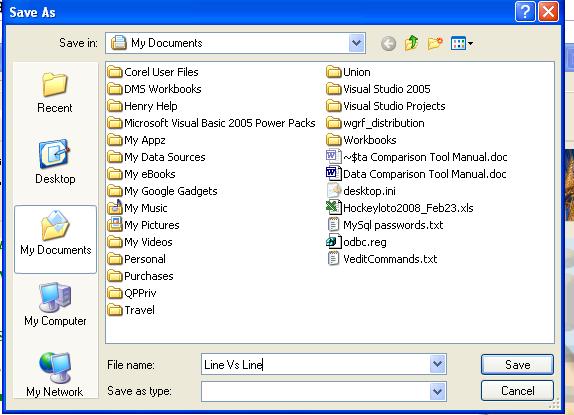
Fig. 15. Save Output screen
If the output is successfully saved, a pop-up message will appear confirming this to the user.
At this point, the user is returned to the main menu. The output can be viewed by going to the folder where it was saved and double clicking on the .xls file.
Output
Line Vs. Line Output
The Line Vs. Line Comparison allows users to view the results of their query in a side-by-side format:
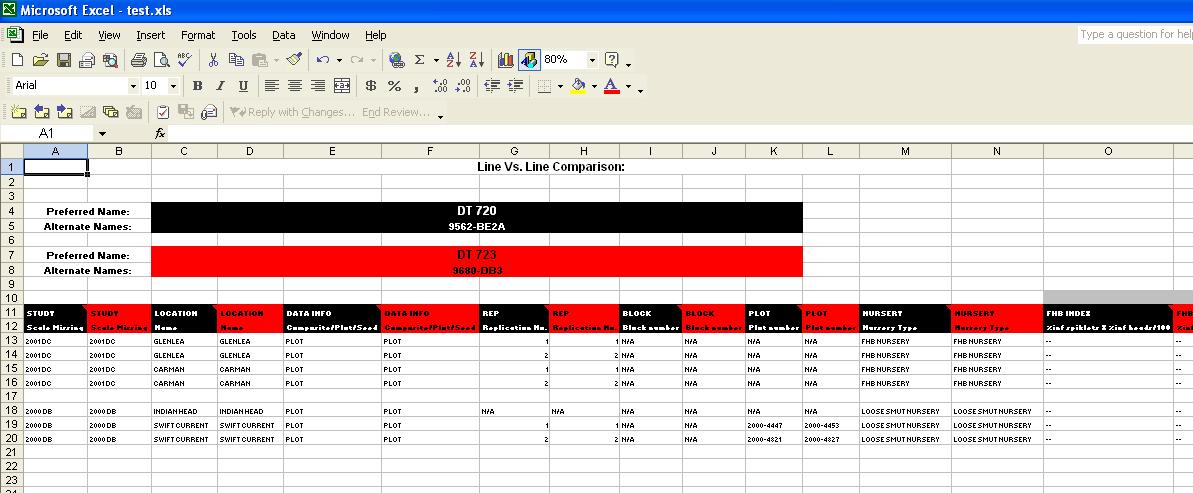
Fig. 16. Line Vs. Line output (without checks)
Along the top portion, each line entered by the user is displayed, along with any Alternate Names found in the GMS. Each line is also given a colour, which corresponds to the colour in the columns of data below. So, in the example above, any columns of data that are black, relate to DT 720 and any columns that are red relate to DT 723.
Each column shows the Factor or Variate name, the scale, and the method can be displayed in a comment box by scrolling over the Factor or Variate name. Above the Variate names, in grey, are the Trait names that are associated with the Variates. These are the values that the user chose on the Traits screen.
In all queries, a blank row will separate Studies, to help make the output easier to follow.
Line Vs. Line (with checks) Output
When the option to add checks from all found studies is selected, the output changes:
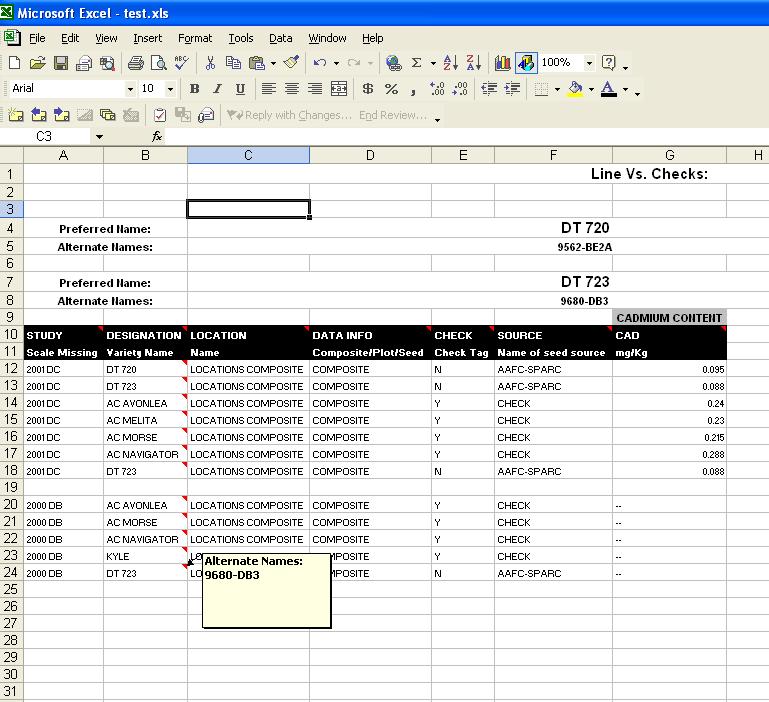
Fig. 17. Line Vs Line Output (with checks added)
The top portion of this output is similar to the Line Vs. Line output without checks. Each line that the user had entered is shown, along with any alternate names. The data section however, is quite different. In this output, the data is not separated side-by-side, but rather just displayed into one column per factor and variate with each row representing the data for a line. Note that now the checks from each study are also included, along with the lines entered by the user. Therefore, it is imperative that the user chooses "Designation" or a similar Factor that holds the line names, in order to understand which data is associated with the proper line. If the Factor "Designation" is chosen (which is an ICIS default), all line names in that column are the Preferred names, and by scrolling over top of each cell, the user can see any Alternate names for that line.
Each column shows the Factor or Variate name, the scale, and the method can be displayed in a comment box by scrolling over the Factor or Variate name. Above the Variate names, in grey, are the Trait names that are associated with the Variates. These are the values that the user chose on the Traits screen.
In all queries, a blank row will separate Studies, to help make the output easier to follow.
Study Retriever Output
The output for the Study Retriever displays all chosen data for 1 DMS study:
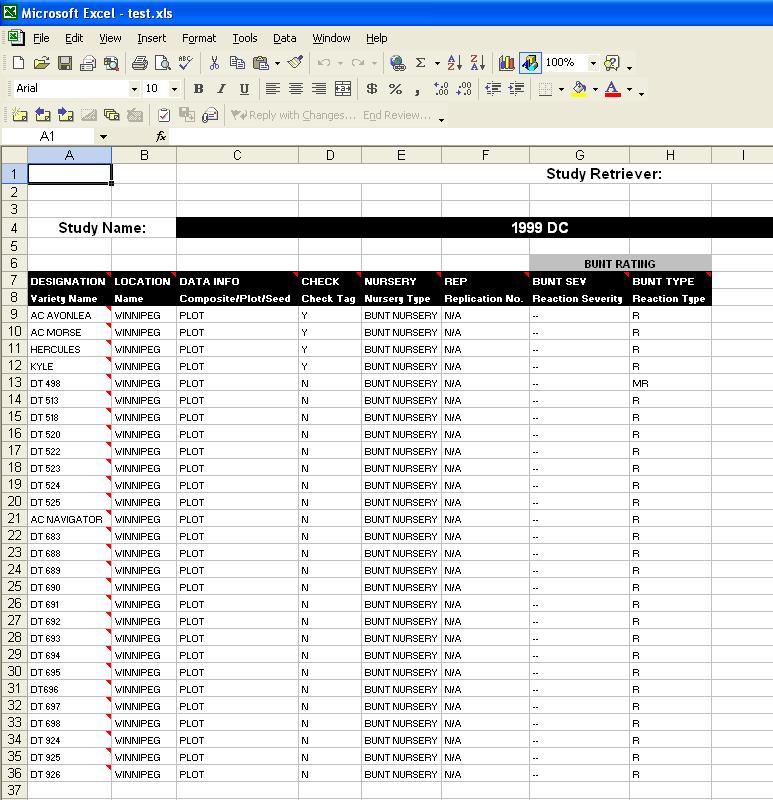
Fig. 18. Study Retriever Output
At the top of the output is the name of the Study chosen by the user. The bottom portion has the data for each factor and variate displayed in each column, with the rows representing the data for a line, therefore it is imperative that the user chooses "Designation" or a similar Factor that holds the line names, in order to understand which data is associated with the proper line. If the Factor "Designation" is chosen (which is an ICIS default), all line names in that column are the Preferred names, and by scrolling over top of each cell, the user can see any Alternate names for that line.
Each column shows the Factor or Variate name, the scale, and the method can be displayed in a comment box by scrolling over the Factor or Variate name. Above the Variate names, in grey, are the Trait names that are associated with the Variates. These are the values that the user chose on the Traits screen.
Germplasm List Retriever Output
There are two possible outputs for the Germplasm List Retriever, depending on the user selection.
Common Studies Output
The Common Studies output allows the user to see which DMS Studies the lines within the chosen Germplasm List are present:
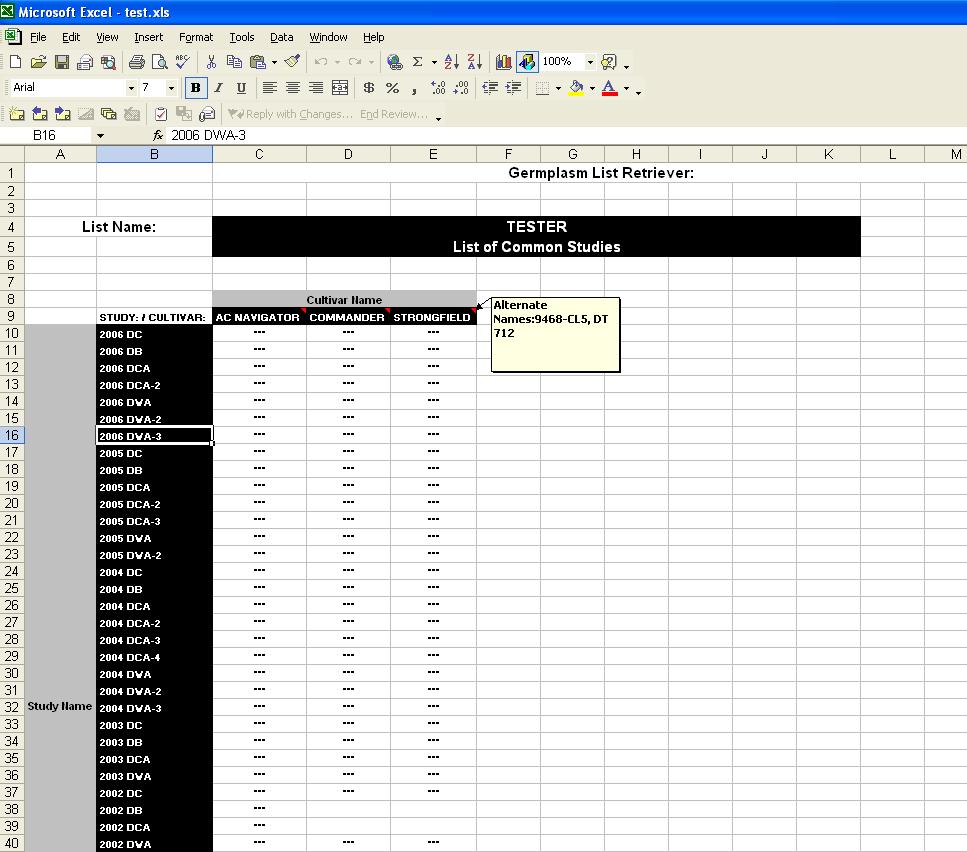
Fig. 19. Common Studies output
This simple output has the Germplasm List name at the top of the spreadsheet, and then a matrix with line names across the columns and studies along the rows. A "--" indicates that the line appears in that study. Scrolling along the line names will show any alternate names in a comment box.
Data Output
The output for the Germplasm List Retriever when the option to query data is selected, is similar to the Study Retriever output:
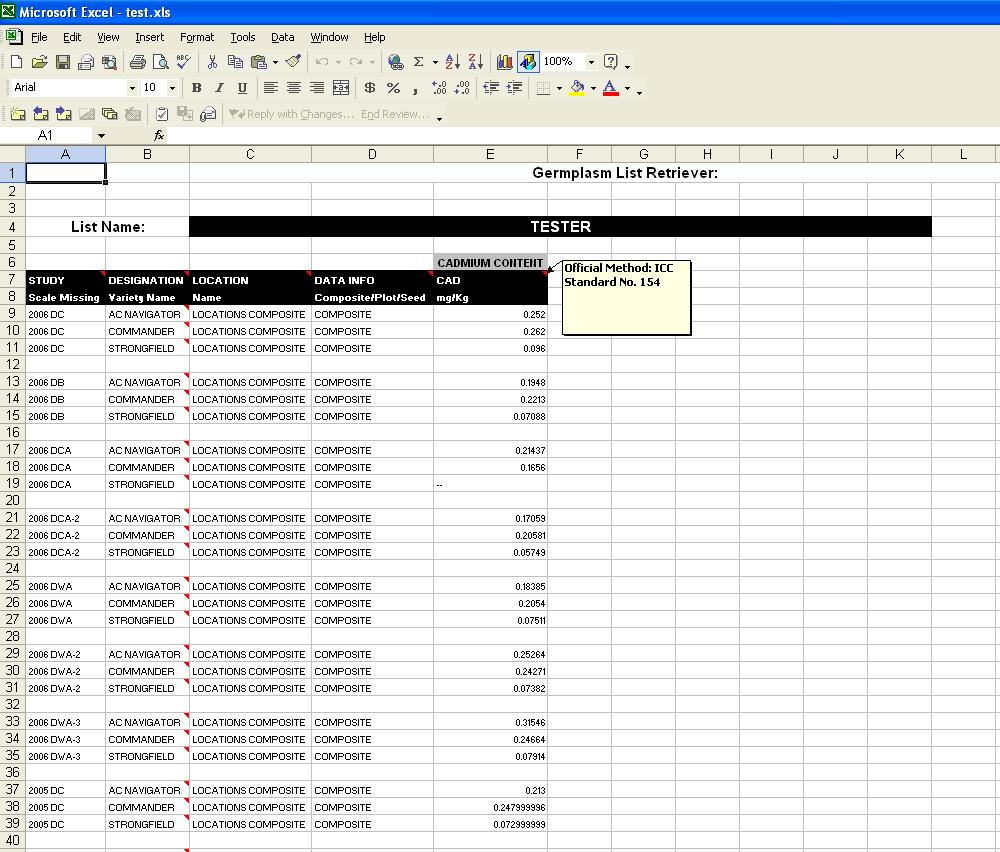
Fig. 20. Germplasm List Retriever (data query)
The output has the Germplasm List name at the top of the spreadsheet, and then the data for each factor and variate displayed in each column, with the rows representing the data for a line, therefore it is imperative that the user chooses "Designation" or a similar Factor that holds the line names, in order to understand which data is associated with the proper line. If the Factor "Designation" is chosen (which is an ICIS default), all line names in that column are the Preferred names, and by scrolling over top of each cell, the user can see any Alternate names for that line.
Each column shows the Factor or Variate name, the scale, and the method can be displayed in a comment box by scrolling over the Factor or Variate name. Above the Variate names, in grey, are the Trait names that are associated with the Variates. These are the values that the user chose on the Traits screen.
Troubleshooting
"The Data Comparison Tool does not start from the ICIS Launcher or crashes when started."
- Make sure that ICIS is correctly installed on your machine
- Make sure that a proper .ini file has been chosen on the ICIS Launcher and that all ODBC DSN values for the databases are set up properly.
- Check the Launcher.txt file and make sure that the correct path has been specified next to the “Data Comparison Tool” entry.
“I get the error that there is no data for the line(s) that I entered, but I know that there should be.”
- Make sure the line spelling is correct.
- Double check that the correct .ini file is being used
- Contact the ICIS administrator to make sure the data has been loaded or that no problems have occurred when loading.
“I see that ‘EXCEL.EXE’ or ‘DataComp.exe’ is still running in my processes list, even after I have shut the Data Comparison Tool and Excel down.”
- This is a Microsoft Windows bug that occasionally occurs if there is a problem and is usually discovered when the user goes to shut down their machine. To force a shut down of the process, open the Task Manager (Ctrl-Alt-Delete) and go to the “Processes” tab. Select “Excel.exe”, click on “End Process” and “OK” at the prompt.
“The Data Comparison Tool Crashes after I choose which traits I want to include in the output.”
- Try the query again with different traits or factors to see if the problem is database-related. If it runs properly, contact your ICIS administrator to make sure the databases are properly loaded.
- Check that the version of Excel installed on the machine is working properly.
- If the number of rows in the output exceeds 65,535, older versions of Excel will crash as that is the maximum number of rows a worksheet can handle. Try running the query on Excel 2007, as it allows for over 1 million rows.
Setup
The Data Comparison Tool will work without any modification of the existing ICIS.ini file, but there are additional options available for users that wish to incorporate them:
Options
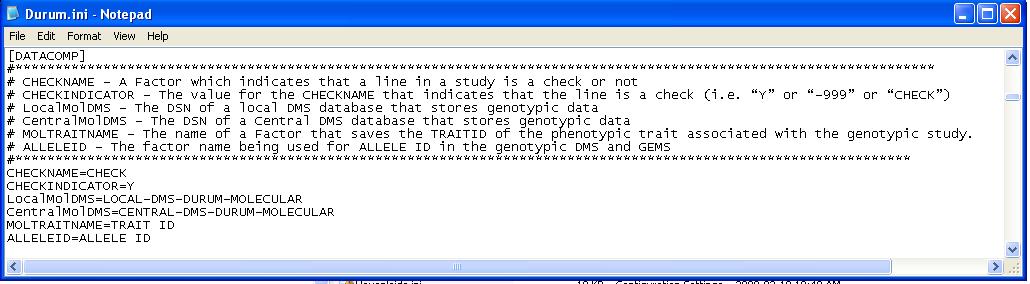
Fig. 21. Example of .ini file key entries for the Data Comparison Tool
Including Checks Option (Line Vs. Line Comparison):
To include data from checks into the output the following must be in the .ini file:
- CHECKNAME - A Factor which indicates that a line in a study is a check or not.
- CHECKINDICATOR - The value for the CHECKNAME that indicates that the line is a check (i.e. “Y” or “-999” or “CHECK”)
Include Genotypic Data Option (All queries):
To include genotypic data into the output the following must be in the .ini file:
- LocalMolDMS - The DSN of a local DMS database that stores genotypic data.
- CentralMolDMS - The DSN of a Central DMS database that stores genotypic data.
- MOLTRAITNAME - A Factor that saves the TRAITID of the phenotypic trait associated with the genotypic study. For example, if the Genotypic study included markers associated with Leaf Rust, a factor could be added to the Genotypic study that saves the TRAITID of Leaf Rust from the phenotypic DMS database can be stored in the Genotypic DMS database to connect the genotypic study with the phenotypic data for leaf rust.
- ALLELEID - The factor name being used for ALLELE ID in the genotypic DMS and GEMS.
Other
Crop Name
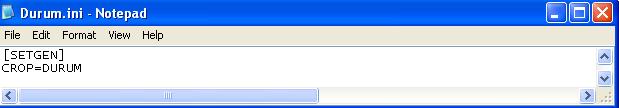
Fig. 22. Example of SetGen CROP key
- CROP - If the crop name is entered in this SetGen key, the application will use that value as the Crop Name.
Testing
This application was tested using ODBC Drivers on Microsoft Access and MySQL databases.
Further Help
For further explanation on these .ini settings, please contact Shawn Yates .

