TDM Gene Management System 5.4
From ICISWiki
MANAGEMENT OF GENETIC DATA
Contents |
Introduction
Crop researchers will increasingly need access to molecular marker data in readily useable formats that can be easily linked to data from classical genetics and phenotypic evaluation. The ICIS data model will therefore store data from molecular analysis of genetic entities (GENs) and integrate these data with information on genealogy and phenotypes. The greatest potential for using molecular data however, is through integration of data across studies and through links to external molecular and sequence databases such as MaizeDB, GrainGenes and RiceGenes for crop specific molecular data and EMBL and SWISSPROT for DNA and protein sequence information respectively. The Gene Management System (GEMS) of ICIS will facilitate this integration and linkage. GEMS will manage classical genetic information and molecular characterization in an analogous way to that in which ICIS location management tools handle locations. The specific functions of GEMS are:
- unique identification of genetic variants including molecular polymorphisms, sequences and traditional genes;
- management of nomenclature of molecular variants;
- identification of sources of different molecular variants;
- identification of loci and alleles including molecular and physical mapping positions;
- linkage of genes to traits and products.
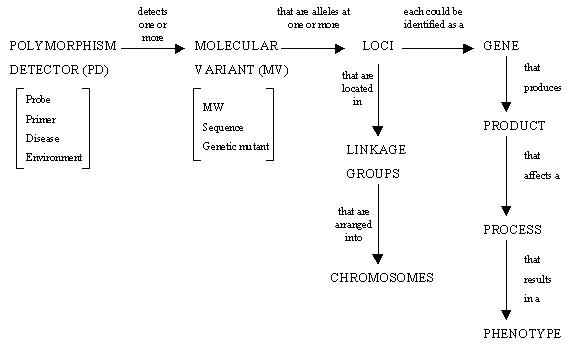
Molecular data result from an analysis of variations in genetic code between different GENs. These molecular polymorphisms or molecular variants (MVs) are detected by the application of polymorphism detectors (PDs) for example, different combinations of restriction with specific enzymes and or amplification with specific primers. Each PD results in a distinct set of identifiable MVs that are present or absent in individual GENs. Depending on the PD used, the molecular variants can be identified simply as morphs or variants (as is the case with dominant PDs) or as alleles (as in the case with co-dominant PDs) or as nucleotides when sequencing technology is used. When co-dominant PDs are used, the different forms of the marker should be detectable in diploid organisms to allow the discrimination of homozygotes and heterozygotes. Dominant PDs, however, are not able to distinguish between homozygotes and eterozygotes. In the case of both dominant PDs (e.g., AFLPs, RAPDs) and co-dominant PDs (e.g., RFLPs, isozymes, SSRs) the occurrence of variants can be used to assess genetic diversity and to infer relationships among GENs. In both cases, it is also possible to identify the positions or loci of MVs in linkage groups or on chromosomes, by mapping them using linkage disequilibrium in segregating populations. This process identifies both the marker loci and different MVs or alleles that occur at those loci. However it is less common that MVs detected by dominant PDs are mapped, so most data reported in the literature on map position tend to be from co-dominant PDs. Nucleotide differences detected by sequencing can also be mapped to loci.
Molecular Data
Data produced from molecular studies will be stored in DMS and may be linked to GEMS (the Gene Management System). The following sections describe the different types of molecular data that can be managed.
Molecular Variant Data
Primary molecular data generally comes in one of two basic forms depending on the detection method used. With gel based detection methods the data are usually presented as a table of values classified by GENs, PDs and MVs. The values are often presence or absence of MVs in each GEN, but may also be frequencies or intensities. This basic data can be stored in the DMS and indexed by:
- GEN is a factor with trait GENETIC ENTITY with levels identified either by the name of the germplasm or by the Germplasm Identifier (GID) from GMS or both.
- PD is a factor with trait POLYMORPHISM DETECTOR with levels identified byname or PDID from GEMS, or both
- MV is a factor of the trait MOLECULAR VARIANT with levels identified by molecular weights, names, row numbers or MVID from GEMS
Data from automatic sequencers are usually molecular weights and in this case, only two indexing factors are required in the DMS; GEN and PD. In this case MV is a variate of the trait MOLECULAR VARIANT with values being the molecular weights. This data is easily represented in the presence absence format by identifying molecular weights with alleles and recording presence or absence for each GEN.
In the case of presence / absence data, when dominant PDs are used, the occurrences are zero (absence) or one (presence) of each MV. In the case of co-dominant PDs, the ploidy level of the crop affects how the variants are scored. When the crop is a diploid, it is possible to score the alleles as 0 (the allele not present), 1 (one copy of the allele present, i.e. a heterozygote) or 2 (two copies of the allele present, i.e. a homozygote). However, if the crop is a hexaploid, then this numbering system isn’t suitable, and would have to be extended to allow the presence of the allele up to 6 times. Consequently, the decision on how to score co-dominant data is crop dependent. Another score (often 9) is used to indicate a missing datum, for data derived from both dominant and co-dominant PDs. When sequencing PDs are used, the variants are scored as A (adenine), G (guanine), C (cytosine), T (thymine), R (=G or A), Y (=C or T) or N (=A or C or G or T).
Polymorphism Detectors
The PDs that generate the MV data can be classified into four basic categories:
- Co-dominant PCR based, e.g. SSRs
- Dominant PCR based, e.g. AFLPs, RAPDs
- Co-dominant non-PCR based, e.g. RFLP, isozymes
- Sequencing.
Table 1 lists information required to document PDs. All the information in the table can be effectively managed as METHODS of the trait POLYMORPHISM DETECTOR in DMS. However, the information in bold type is the minimal required to link the use of a particular PD across studies and thence to link particular MVs. Hence this information is used for the definition of unique PDIDs in GEMS for amalgamating data across studies.
Table 1: Information required to document the use of PDs
| Co-dominant PCR based markers, e.g. SSRs | Dominant PCR-based markers, e.g. AFLPs, RAPDs | Co-dominant non-PCR based PDs, e.g. RFLPs, isozymes | Sequencing |
| Type | Type | Type | Type |
| Primer Sequence | Primer Sequence | Probe/Enzyme | Technique used |
| Amplification conditions | Amplification conditions | Hybridisation conditions | Amplification conditions |
| Electrophoresis conditions | Electrophoresis conditions | Electrophoresis conditions | Electrophoresis conditions |
| Detection Method | Detection Method | Detection Method | Detection Method |
| How Scored: Lane Standards / Eye vs. Computer aided / GEN Standard | How Scored: Lane Standards / Eye vs. Computer aided / GEN Standard | How Scored: Lane Standards / Eye vs. Computer aided / GEN Standard | How Scored: Automated / Manual |
| Laboratory | Laboratory | Laboratory | Laboratory |
| Who interpreted gel | Who interpreted gel | Who interpreted gel | Who interpreted gel |
| Reference | Reference | Reference | Reference |
(Minimal essential fields for defining unique PDIDs in GEMS are in bold)
Molecular Variants
Polymorphisms revealed by PDs may be identified only within studies, but are available for more powerful integrative analysis if they are identified across studies. This is usually done by determining (estimating) the molecular weights of specific fragments, if this was not the original MV data and assigning a unique MVID based on the PDID and the molecular weight. Estimation of molecular weights to a sufficient accuracy to identify MVs across studies is an issue to be managed by the system curator. This problem is frequently addressed by including common genotypes in all experiments across all labs. This provides common reference points used to identify individual MVs across studies.
Table 2: Data on Molecular Variants which can be managed in GEMS
| Co-dominant markers PCR based and non PCR based | Dominant PCR-based markers, e.g. AFLPs, RAPDs | Genes identified by non molecular methods | Sequencing |
| GID | GID | GID | GID |
| Polymorphism detector (PDID) | PDID | Method of discovery (PDID) | PDID |
| ID of allele scored (MVID) | ID of morph scored (MVID) | Allele ID (MVID) | ID of nucleotide scored (MVID) |
| Size of allele scored | Size of morph | Nucleotide position | |
| Range of possible allele sizes | Range of possible morph sizes | ||
| Gene/marker to which allele belongs | [Whether morphs identified as alleles] | The name of the gene/marker being sequenced | |
| Position or locus information | Repeatability | Position or locus information | Repeatability |
| Image of gel / autorad | Image of gel / autorad | Image of gel / autorad | |
| Trait(s) affected by gene | Trait(s) affected by gene |
(Minimum data requirements for the definition of molecular variants in GEMS shown in bold)
Table 2 lists information on MVs which can be managed in GEMS to facilitate integrative analysis across studies. The minimum data required to uniquely identify a molecular variant is shown in bold in the table. If this information has not been recorded within a particular study, then the MV data are simply indexed by MV name and GEN in the DMS, together with information on the PD. If it is desirable to compare the data across studies, then it will be necessary to return to original sources and determine the missing information.
Derived Data
Table 3: Examples of derived molecular data
| Co-dominant PCR based markers, e.g. SSRs | Dominant PCR-based markers, e.g. AFLPs, RAPDs | Co-dominant non-PCR based PDs, e.g. RFLPs, isozymes | Sequencing |
| Total number of alleles | Total number of morphs | Total number of alleles | Total number of nucleotides |
| % polymorphism | % polymorphism | % polymorphism | % polymorphism |
| Molecular Genotype | Molecular Genotype | Molecular Genotype | |
| Locus/loci to which allele is mapped | Locus/loci to which allele is mapped | Locus/loci to which allele is mapped | Locus / loci to which sequence is mapped |
| Linkage group(s) to which locus/ loci belongs | Linkage group(s) to which locus/ loci belongs | Linkage group(s) to which locus/ loci belongs | Linkage group(s) to which locus/ loci belongs |
| Function of gene | Function of gene | Function of gene | Function of gene |
| GEN containing MV | GEN containing MV | GEN containing MV | GEN containing MV |
Various types of information can be derived from the MV data. Table 3 gives examples of derived data. These data can be divided into three basic types.
Diversity Data
Total number of variants observed and percent polymorphism reflect the genetic diversity of the target GENs. These Derived Variates (DVs) belonging to appropriately defined traits (e.g. TOTAL NUMBER OF MOLECULAR VARIANTS, POLYMORPHISM CONTENT OF MV DATA) can be managed effectively in the DMS.
Molecular Genotype Data
When MV data are collected on a defined population of lines, derived from a specific cross (usually called a mapping population) an analysis of the parental origin of each MV present in one parent but absent in the other results in a table of Molecular Genotype Data. Such data can be stored as a derived variate in the DMS, belonging to the trait MOLECULAR GENOTYPE, indexed by PD, MV and GEN.
Mapping Data
Mapping data, unlike diversity and molecular genotype data, require the GEMS for effective management, because of the importance of integrating these data across studies, in order to produce consensus maps.
A mapping analysis assigns each MV to a position on a chromosome called a locus. The loci are resolved into linkage groups and when sufficient loci have been isolated in the genome, there will be one linkage group per chromosome. Variants of the same PD that do not recombine are called alleles and assigned to the same locus. Both marker loci and their alleles may be named within studies, but for integrative analysis they should be named consistently across studies. Naming of marker loci and their alleles both across studies and keeping track of their relationships are functions of GEMS.
The loci associated with linkage groups can be ordered into a linear linkage map defined by a group number, often corresponding to a chromosome (if physical mapping has been done), and a linkage distance for each locus along the group. There are two major components of molecular mapping data; linkage group information and information on the distances among loci within a group. Linkage group information is stored in the table LGROUPS in GEMS. The distances are stored as a variate belonging to the trait LINKAGE DISTANCE (LKDIST), and are indexed by locus names (defined in GEMS).
Stored maps can be updated as more data are added to the MV data. The construction of consensus maps entails an assessment of the names and relationships among the PD, MV data, ALLELE and LOCUS across studies. These cross study comparisons require that each entity is uniquely identified and the relationships managed by GEMS. The information on both major genes and QTLs, including information on their phenotypic effects, are also managed by GEMS.
The Gene Management System Table Structure
GEMS uses the following table structure to store details on polymorphism detectors, molecular variants, alleles, genes and loci, which is based on the genetic relationships shown below.
Generation Challege program has defined a genotype Model and listed definitions for some of the terms used for genotype data.
Table Relationships
The central table of GEMS is the Molecular Variant table (gems_mv). This defines whether the molecular variant data scored are alleles, morphs or nucleotides. It also stores the information on the molecular weight of each molecular variant, with the amount of tolerance allowed around this figure. For example, an allele size run on a polyacrylamide gel on an ABI Sequencer may be identified to within ±1 base pairs. However, if the same allele is run on an agarose gel, the tolerance range may increase to ±3 base pairs, due to the lower sensitivity of agarose gels. The gems_mv table links to the gems_locus table, which identifies the loci where the alleles are located. The gems_mv table is also linked to the gems_marker_detector table which contains information on markers. The gems_mv and gems_marker_detector tables are linked to the gems_names table. The mvid field of the gems_mv table and the mdid field of gems_marker_detector are linked to the gobjid of the gems_names table. The gnobtype field of the gems_names table identifies whether a name is an MV or MARKER_DETECTOR. The gems_names table acts as a catalogue of molecular variants names and marker names (possibly other objects in GEMS such as protocol), which can be identified across studies. With these tables linked together, management of synonyms used across studies can be facilitated.
The gems_marker_detector table is linked to the gems_pd table (Polymorphism Detector) table. The primary key (pdid) in the gems_pd table defines a combination of marker detector id and protocol/condition id. The gems_pd table is linked to tables that define the conditions/protocol that produced the molecular variants. The set of conditions used to define a unique PD corresponds to the fields in bold type in Table 1.
Bibliographic References are stored in the DMS table BIBREFS.
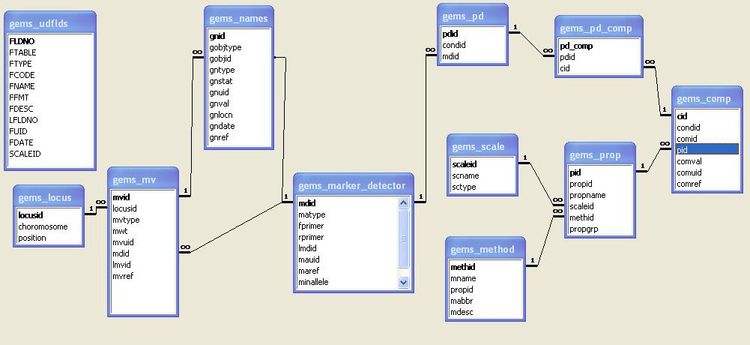
Table Definitions
GEMS_NAMES
GEMS_NAMES table serves as a catalogue of marker detector names and molecular variant names. GOBJTYPE contains the table name where all other information regarding the name specified in the GNVAL field can be found. GNID is the unique identifier of a specific name. GOBJID is the link between the GEMS_NAMES table and the table in the GOBJTYPE.
Ex.
GNID = 2715
GOBJID = 1200
GOBJTYPE = gems_mv
GNVAL = RM105_143
...
this entry indicates that "RM105_143" is a molecular variant name which is identified by
unique id = 2715 in the GEMS_NAMES table. It is also identified by a unique id = 1200
in the GEMS_MV table. The Unique Identifier in the GEMS_MV table is MVID.
Table 4. GEMS_NAMES table
| Fieldname | Description | Type |
|---|---|---|
| gnid | Long | Unique ID of the Name |
| gobjid | Long | Unique ID of Name in the gobjtype Table |
| gobjtype | Varchar(255) | Table Name where the name can be found |
| gntype | Long | Type of Name GEMS Name Types |
| gnstat | Long | Status of Name (0- default value 1 - synonyms) |
| gnval | Varchar(255) | Name Value |
| gnlocn | Long | Location where Name was assigned |
| gndate | Long | date when Name was assigned |
| gnuid | Long | User who assigned the Name |
| gnref | Long | Reference ; linked to the BIBREFS table |
GEMS_MARKER_DETECTOR
GEMS_MARKER_DETECTOR table contains information on marker detectors.
Table 5. GEMS_MARKER_DETECTOR table
| Fieldname | Description | Type |
|---|---|---|
| mdid | Long | Unique ID of the Marker Detector |
| matype | Varchar(255) | Marker Detector Type (ex. SSR, DArT) |
| fprimer | Varchar(255) | Forward Primer |
| rprimer | Varchar(255) | Reverse Primer |
| lmdid | Long | Local Marker Detector ID |
| mauid | Long | User ID |
| maref | Varchar(255) | Reference ; linked to the BIBREFS table |
| minallele | Long | known minimum allele value |
| maxallele | Long | known maximum allele value |
GEMS_MV
GEMS_MV stores information on molecular variant names. Each molecular variant is uniquely identified by the MVID field. Each MVID is associated with an MDID value. The MDID field contains the marker detector ID of the marker detector which detected the variant. It is the link between the GEMS_MV table and the GEMS_MARKER_DETECTOR table. The GEMS_MV table is also linked to the GEMS_LOCUS table via the LOCUSID field.
Table 6. GEMS_MV table
| Fieldname | Description | Type |
|---|---|---|
| mvid | Long | Unique Molecular Variant ID |
| locusid | Long | Locus ID where the MV is associated |
| mvtype | Varchar(255) | Type of Molecular Variant (Allele,Morph,Nucleotide) |
| mwt | Long | Molecular weight the Molecular Variant |
| mdid | Long | Marker Detector ID used to detect the MV |
| lmvid | Long | Local MVID |
| mvuid | Long | User ID who defined the MV |
| mvref | Long | Reference ; linked to the BIBREFS table |
GEMS_PD
GEMS_PD (Polymorphic Detector) contains the different combination of Marker Detector ID(MDID) and condition ID (condid). A marker detector can have one or more condition (or protocols). A protocol/condition can also be used for different markers. This creates a many-to-many relationship between the markers and protocols.
Table 7. GEMS_PD table
| Fieldname | Description | Type |
|---|---|---|
| pdid | Long | Polymorphic Detector ID |
| condid | Long | Unique Condition ID |
| mdid | Long | Marker Detector ID (link to GEMS_MARKER_DETECTOR table) |
GEMS_PD_COMP
GEMS_PD_COMP (Polymorphic Detector and Components) table serves as the intermediate table to break the many-to-many relationship between the protocols/conditions and marker detector. Each Polymorphic Detector has many components (cid). Each of these component is futher defined in the GEMS_COMP table.
Table 8. GEMS_PD_COMP table
| Fieldname | Description | Type |
|---|---|---|
| pd_comp | Long | Unique ID for the Combination of PDID and CID |
| Pdid | Long | Polymorphic Detector ID(linked to GEMS_PD table) |
| cid | Long | Component ID (linked to GEMS_COMP table) |
GEMS_COMP
The GEMS_COMP table contains the information on each component of a Polymorphic Detector. Each component is defined by its properties and its value. The Value of the Component is stored in the COMVAL field while its properties is defined thru another table called GEMS_PROP table. The link between this two table is the PID field.
Table 9. GEMS_COMP table
| Fieldname | Description | Type |
|---|---|---|
| cid | Long | Unique ID for the Component |
| Condid | Long | Condition ID |
| Comid | Long | Component Group ID used to group components |
| Pid | Long | Unique Property ID (linked to GEMS_PROP) |
| Comval | Varchar(255) | Value |
| Comuid | Long | User ID |
| Comref | Long | Reference; linked to the BIBREFS table |
GEMS_PROP
GEMS_PROP table defines the property, method and scale used by each component in the GEMS_COMP table.
Table 10. GEMS_PROP table
| Fieldname | Description | Type |
|---|---|---|
| pid | Long | Unique ID for the combination of propid, scaleid, methid |
| propid | Long | Property ID |
| propname | Long | Property Name |
| scaleid | Long | Scale ID (linked to GEMS_SCALE table);scale used to measure |
| methid | Long | Method ID (linked to GEMS_METHOD) method used |
| propgrp | Varchar(255) | Name of Property Group where property is associated |
GEMS_LOCUS
GEMS_LOCUS table contains information on chromosome and location of a molecular variant
Table 11. GEMS_LOCUS table
| Fieldname | Description | Type |
|---|---|---|
| locusid | Long | Unique ID for the Locus |
| chromosome | Varchar(50) | Name/Type of Map |
| position | double | Position in the Map |
GEMS_METHOD
GEMS_METHOD table contains information on the methods used in the GEMS_COMP table
Table 12. GEMS_METHOD table
| Fieldname | Description | Type |
|---|---|---|
| Methid | Long | Unique Id for Method used |
| mname | Varchar(255) | Method Name |
| mabbr | Varchar(255) | Abbreviated name |
| mdesc | Varchar(255) | Description of the method |
GEMS_SCALE
GEMS_SCALE table contains information on the scales used in the GEMS_COMP table.
Table 13. GEMS_SCALE table
| Fieldname | Description | Type |
|---|---|---|
| Scaleid | Long | Unique ID for a scale or measurement unit |
| Scname | Varchar(255) | Scale Name |
| Sctype | Varchar(255) | Type of Scale |
GEMS_MAP
GEMS_MAP table contains information on maps used in GEMS_LOCUS
Table 14. GEMS_MAP table
| Fieldname | Description | Type |
|---|---|---|
| mapid | Long | Unique ID for a given map |
| maptype | Varchar(255) | type of map |
Examples of Data Input
Diversity Array Technology(DArT) data
Simple Sequence Repeat (SSR) data
RAPD diversity study
Consider the following small data set, 5 GENs by 3 MVs, produced using RAPDs (Random Amplified Polymorphic DNA). The data can be listed in serial format as follows:
| GID | PDID | MVID | MV |
|---|---|---|---|
| Rx101 | 1 | 1 | 1 |
| Rx189 | 1 | 1 | 1 |
| Rx235 | 1 | 1 | 0 |
| Rx349 | 1 | 1 | 1 |
| Rx420 | 1 | 1 | 0 |
| Rx101 | 1 | 2 | 1 |
| Rx189 | 1 | 2 | 0 |
| Rx235 | 1 | 2 | 0 |
| Rx349 | 1 | 2 | 1 |
| Rx420 | 1 | 2 | 0 |
| Rx101 | 1 | 3 | 1 |
| Rx189 | 1 | 3 | 0 |
| Rx235 | 1 | 3 | 1 |
| Rx349 | 1 | 3 | 0 |
| Rx420 | 1 | 3 | 0 |
The first 3 columns are factors in the DMS and the values in the columns are stored as levels of these factors. The last column is a variate and the values in this column are stored as data. In addition, the PDIDs and the MVIDs link to GEMS, as follows:
| === |
| |||||||||||||||||||||||||
The GIDs also link to the GMS. If the MVs are mapped at a later stage, the MVIDs can be linked to the locus and linkage groups identified. Further information on the PD is stored as METHODS of the trait POLYMORPHISM DETECTORS.
Data Output
There are four basic functions of data output from GEMS and DMS.
- Estimates of diversity / similarity: It will be possible to compare the marker data with observed traits and known pedigrees. In this way, the marker data can act as a tool to validate pedigrees, and can be compared with the output from Coefficients of Parentage and genealogies.
- Information on genes and markers for sets of lines: The data can be extracted in tabular form or as dendrograms, and will be very useful in combining information across studies for the production of consensus maps.
- Tools for identifying relationships between phenotypic and genetic data
- Tools for inferring genotypes based on partial genetic or molecular characterisation and pedigree information.
Summary
Both primary and derived data produced from molecular studies can be effectively managed in ICIS through the DMS and GEMS. For more powerful, integrative across studies analyses, it is more appropriate to use GEMS to manage the information associated with both the primary and derived data. However, the user can also enter the data into the DMS alone. This data can be transferred to GEMS at a later date, through a Molecular Biology Interface, if it is considered necessary to compare the data across studies. Table 4 lists the traits that have to be defined for managing the data in the DMS, and their associated scales and methods.
As the methods and scales of the Traits PD and MV show, the amount of information that is necessary to store in the DMS is dependent on whether or not the GEMS is also used. In particular, when the GEMS is used to manage data on the PD, it is not necessary to store information on the type of PD used, the enzymes / probes / primers used in the methods, as this is handled in the PD table.
Table 14: Information on the traits required for storing molecular data in ICIS in the DMS
| NAME | TYPE | TRAIT | SCALEs | METHODs |
|---|---|---|---|---|
| PD | FACTOR | POLYMORPHISM DETECTOR | PD_ID; Type; Not specified; | SCAR; STS; RFLP; SSR; ISSR; RAPD; AFLP; etc. |
| MV | FACTOR / VARIATE | MOLECULAR VARIANT | Molecular weight (bp); Name; Relative position on gel; MV_ID; Allele name | Detection methods |
| GEN | FACTOR | GERMPLASM ENTRY | Name; GID; Accession number | Cult method; Not specified |
| LKDIST | DERIVED VARIATE | LINKAGE DISTANCE | Recombination frequency (%); centrimorgans (cM) | Calculation methods |
| LG | DERIVED VARIATE | LINKAGE_GROUP | Chromosome identifier; Linkage group identifier | Calculation methods |
| MG | DERIVED VARIATE | MOLECULAR GENOTYPE | Presence Parent1 / presence parent 2 | Calculation methods |
| MV_NUM | DERIVED VARIATE | TOTAL NUMBER OF MOLECULAR VARIANTS (MVNUM) | Number of mvs | By eye / computer aided |
| MV_POLY | DERIVED VARIATE | POLYMORPHISM CONTENT OF MOLECULAR VARIANTS (MVPOLY) | %, proportion | Calculation methods |
| IMAGE | VARIATE | MOLECULAR VARIANT | .Bmp / .jpg / .tif file | Image capture method |

